PDF File: (Click to Down Load): Chapter5.pdf
(Chapter 5 Campbell & White).
Great site for Raman (a must see, you can run the spectrometer on line...)
Bristol University IR Spectroscopy
Whitworth College IR/NMR problems
http://chipo.chem.uic.edu/web1/ocol/spec/IR.htm (Application/Chemistry)
http://www-wilson.ucsd.edu/education/spectroscopy/spectroscopy.html (Physics)
http://www.columbia.edu/cu/chemistry/edison/IRTutor.html (Spectra) Good Movies
http://avogadro.chem.iastate.edu/chem572/ (Chemistry)
Introduction:
The energy associated with electro-magnetic radiation in the infrared range (just above visible in wavelength) is sufficient to excite vibrations of chemical bonds. IR spectroscopy and Raman scattering both involve IR wavelength radiation and both characterize vibrations of chemical bonds. For this reason they are usually considered as a group although the instrumental details for the two techniques are significantly different.
The vibration of any structure is analyzed in terms of the degrees of freedom which the structure possesses. For example, a sphere has 3 degrees of transitional freedom and 0 degrees of rotational freedom since rotation does not result in a perceptibly different state. A single sphere or a single atom does not have vibrational states. When two spheres are bonded the group has 3*2 degrees of translational freedom.
The grouping of 2 spheres, as a unit, possesses 3 degrees of translational freedom and 2 degrees of rotational freedom, since rotation about the axis of the two spheres does not result in a perceptible change. When considering vibrational states we fix the reference frame on the grouping of objects, so the degrees of freedom for the grouping are subtracted from the total number of translational degrees of freedom for the individual spheres. For two spheres there are 3*2 - (3+2) = 1 degree of vibrational freedom. This means that the IR/Raman spectra for a diatomic molecule such as CO will have one absorption band. This vibration would involve stretching and compressing of the CO bond. For groupings of spheres with more than 2 members the number of vibrational states is 3n-6 so a molecule such as water has 3 vibrational states which results in three absorption bands in IR and Raman. These are symmetric stretching of the H-0 bonds, asymmetric stretching of the H-O bonds and a scissors bending of the HOH structure. The number of stretching vibrations is n-1 and the number of bending vibrations is 2n-5.
Carbon dioxide, O=C=O, is a linear molecule so the number of degrees of freedom are 3n-5 rather than 3n-6, i.e. one of the molecular rotational degrees of freedom, rotation about the molecular axis, does not result in a perceptible change.
The number of IR and Raman absorption bands is calculated from the number of degrees of translational freedom for the collection of atoms in a molecule, 3n, minus the number of degrees of translational and rotational freedom for the molecule as a whole, usually 6, but 5 for a linear molecule.
These normal modes of vibration are useful for consideration of relatively small molecules, i.e. Benzene (C6H6) has 30 absorption bands in IR and Raman, each of which can be described in detail.
Consider a polymer molecule such as a 100,000 gm/mole sample of polystyrene. This molecule contains about 1,000 mer units or 16,000 atoms! The number of vibrational states for this molecule are 3*16,000 - 6 or about 50,000 different vibrations. It is impossible to identify all of the vibrational states for such a molecule. In polymer analysis we can greatly simplify the characteristic spectra for a chain by considering the repeating chemical groups which occur in the chain as independently contributing to the IR and Raman spectra. This approach is called the group contribution approach, and for polystyrene, would involve consideration of the major bands due to aromatic ring bands, C-H vibrations, C-C and C=C vibrations. In the group contribution method many of the weaker bands are simply ignored and we concentrate on the few high absorption bands which serve as a finger print for a particular polymer.
IR Active Bands:
The possible vibrations of a molecule are sensitive to IR absorption if the vibration results in a change in the dipole moment, u, of the molecule. The dipole moment is the product of the charge times distance and is similar to the moment of inertia in mechanics except that charge is the weighting factor rather than mass. When an EM wave in the IR wavelengths irradiates a molecule the electric field acts on the charge distribution in the molecule, i.e. the more polar the molecule the larger the effect. The oscillation of the EM electric field, if of the quantized frequency for absorption by a particular bond, will set the bond in motion, vibrating at the specific frequency needed for that vibrational excitation. The IR absorption experiment involves the oscillating electric field changing the charge distribution so that a dipole is enhanced or diminished. Strong IR absorption bands occur for polar groups such as OH, Cl, and the C=O bond.
In determining if a vibration is IR active consider if there is a change in the sum of the charge*distance vectors, i.e. for a symmetric stretch of O=C=O (linear molecule) the movement of the left O is offset symmetrically by the movement of the right O so there is not net change in the charge * distance vector, not change in the dipole moment so this is not IR active. For a non-linear molecule like HOH (shaped like a V) there is a change in the dipole moment for a symmetric stretch so the vibration is IR active.
Raman Active Bands and The Raman Scattering Experiment:
The Raman scattering experiment involves shifts in the wavelength of an incident monochromatic beam. Raman scattering uses a laser as a light source (IR uses a mercury lamp or other broad spectrum source). The laser is usually in the optical wavelengths. The incident light causes motion of electrons in bonds. These moving electrons reemit light of the same wavelength for elastic scattering. Light scattering is sensitive to the mobility of electrons in bonds. The mobility of electrons in a bond is called the Polarizability of the bond, i.e. a measure of how easy it is to move electrons and polarize a bond. For bonds with a strong dipole moment (which are IR active) the mobility or polarizability is usually low. For bonds which have a weak dipole moment (which are IR inactive) the polarizability is usually high and the vibrational states of the bond are Raman active. IR and Raman activity are complimentary and the two techniques are used to fully characterize the vibrational states of molecules.
Raman scattering is based on a scattering event as described above. Figure 5.4 of Campbell and White shows a schematic of a Raman spectrometer. A laser (usually an argon laser) is incident on a sample. Scattered light is collected usually at 90deg. to the incident beam. The spectrum of the scattered light is measured using either a dispersive spectrometer or a Fourier transform spectrometer. Small shifts in the wavelength from the incident wavelength due to inelastic scattering are measured in the Raman spectrometer.
In the Raman measurement, an incident EM wave induces polarization of a bond through the EM wave's electric field. The energy of this excitation of the atom is h[nu]0, where [nu]0 is a larger frequency (and energy) than the IR range, [nu]vibration. There is a possibility that some of the energy of this excited state can be transferred to the atom in terms of a vibration of the bond, h[nu]vibration. Since the source of this energy is a scattering event, the absorption will be stronger for more polarizable bonds, i.e. bonds with more freedom of movement for the electrons. The loss of energy for the scattered EM wave due to transfer to a vibrational state for the bond is called a Stokes event and the resulting scattered wave is of higher wavelength and lower energy, EStokes = h[nu]0 - h[nu]vibration. The elastically scattered beam of energy ERayleigh = h[nu]0 is 10,000 times more intense than the Stokes line. It is also possible for an incident EM wave to interact with a bond which is already vibrationally excited. In this case an Anti-Stokes line of higher energy results, EAnti-Stokes = h[nu]0 + h[nu]vibration. The anti-Stokes line is much weaker than even the Stokes line. If a number of absorptions occur for a material, then the spectral distribution of scattered light can be measured and the shifts from the Rayleigh (elastic scattering) line converted to wavenumber. A spectrum very similar to an IR absorption spectrum results.
In determining if a vibration is Raman active consider if there is a change in the volume of the electron cloud, i.e. for a symmetric stretch of O=C=O (linear molecule) the movement of the left O is in the opposite direction of the movement of the right O so there is a net change in the volume of the electron cloud within the molecule, this vibration is Raman active. For the asymmetric stretch the movements of the two O's are in the same direction so the volume increase on the left is offset by a volume decrease on the right and the asymmetric stretch is not Raman active.
Since the source of the Raman spectrum is a scattering event, the Scattered Intensity is directly proportional to the concentration of species giving rise to the Raman lines. This is different than in an IR absorption experiment which follows Beer's Law discussed in the previous section.
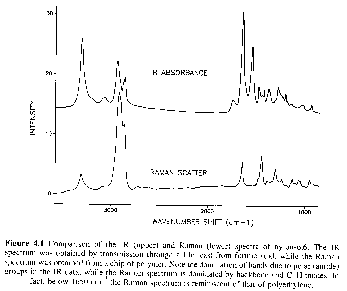
The following two spectra compare the IR and Raman absorption from nylon-6,6: {-(CO)-(CH2)6-(NH)-(CO)-(CH2)4-(CO)-}n. NH stretch is the highest wave number absorption. This is a polar bond so strongly absorbs in IR and weakly in Raman. CH stretch is a doublet below 3000cm-1 (asymmetric and symmetric) which is less polar than NH and has a strong absorption in Raman but a weaker absorption in IR. Carbonyl stretch is a signature band (about 1750cm-1) in IR which is weak in Raman (highly polar and volumetrically inflexible bond).

Intensity and wavenumber of absorptions in IR and Raman
The wavenumber (energy or frequency) of an IR/Raman Absorption depends on the mass of the atoms connected to a chemical bond, the strength of the chemical bond, and the geometry of the molecule. There are two basic types of vibrations, Stretches and Bends. Bends require less energy so occur at lower frequencies for the same or similar bonds. There are generally two types of stretching, symmetric and asymmetric. There are many types of bends, Twisting, Rocking, Scissoring, Tortional, Breathing (For ring molecules) and other specialized bends. Symmetric stretches require lower energy than asymmetric stretches.
For a simple stretching vibration,
![]()
see: http://chipo.chem.uic.edu/web1/ocol/spec/IR1.htm p
where k is a spring constant for the tensile deformation of a bond (bond strength) and u is the geometric mean mass of the two atoms, u = m1 m2/(m1 + m2) at the ends of the bond. This is similar to Campbell and White's description of LAM modes in Raman for polymer crystals which we will discuss near the end of this chapter,
![]() Campbell and White pp. 77 and R. G. Snyder, S. J. Krause, J. R. Scherer, J.
Pollym. Sci. Polym. Phys. ED. 16 1593 (1978, where n = 1, 3, 5, 7, 9...
Campbell and White pp. 77 and R. G. Snyder, S. J. Krause, J. R. Scherer, J.
Pollym. Sci. Polym. Phys. ED. 16 1593 (1978, where n = 1, 3, 5, 7, 9...
where L is the length of a sequence of C-C bonds, n is the order of the vibration (like the modes of a guitar string), [rho] is the density and E is the Young's modulus for deformation of a series of C-C bonds. These equations quantify that higher mass leads to smaller frequencies and stronger bonds lead to higher frequencies of vibration. These equations also indicate that IR absorption is a critical tool for the quantitative determination of certain molecular features such as bond strength or bond modulus.
In most IR books one considers simple molecules first to gain a feel for the position of absorption peaks in the IR spectrum. Usually water and carbon dioxide are discussed first. Often both water and CO2 are present as impurities in polymers so it is important to be able to identify these bands which are not related to the material. Both of these molecules have 3 atoms. Water is not a linear molecule so 3n - 6 = 3 vibrations are expected in the IR and Raman spectra. The three vibrations are shown below (movies of these vibrations are available from the internet site mentioned).


Symmetric Stretch Asymmetric Stretch Symmetric Bend
3652 cm-1 3756 cm-1 712 cm-1
IR active IR active IR active
From: http://chipo.chem.uic.edu/web1/ocol/spec/IR1.htm (see main site above).
The three vibrations are symmetric and asymmetric stretching of the H (white ball) - C (red ball) bonds, and a symmetric bending (scissors bend) of the H-C bonds. There is no asymmetric bend since such a vibration would result in a rotation of the molecule and no relative change of the position of the atoms. These vibrations follow the general rule that there are N-1 stretches (3-1=2) and 2N-5 bends (6-5=1). The symmetric stretch is an easier deformation than the asymmetric stretch so the asymmetric stretch occurs at a higher wavenumber. The bending vibration is much easier than stretching so this occurs at a much lower wavenumber.
Carbon dioxide also displays, 2 stretching and 1 bend vibration.

Symmetric Stretch Asymmetric Stretch Symmetric Bend
1340 cm-1 2350 cm-1 666 cm-1
Raman active IR active IR active
Not IR active
Chloroform and deutero-chloroform are a common example of the effect of mass on absorption bands.

Other Band (Deutero Bend) 1224 cm-1 910 cm-1
Cl Umbrella Bend 765 cm-1 740 cm-1
Group Contribution Method:
As noted above, the large number of atoms in a polymer chain makes the possible number of IR/Raman bands enormous, 3n-6, where n is on the order of 5,000 to 10,000. Synthetic polymer chains are composed of repeated chemical groups, mer units, which are arranged about the chain axis in a similar fashion for all of these groups. The simplest approach to considering the IR/Raman absorption patterns from synthetic polymers is to identify characteristic chemical groups which give rise to absorptions. This approach, of identifying chemical groups as independent contributions to a complex IR/Raman pattern, is called the group contribution method. The basic assumption of the group contribution method is that vibrations from most chemical species are little effected by their bonding to the polymer chain. This approach is accurate in the sense that absorptions for most chemical groups will fall in a limited range which can be distinguished from other absorptions due to the strength of the absorption, for example polar bonds have strong absorptions in IR, combined with the range of wavenumber where the absorptions occur.
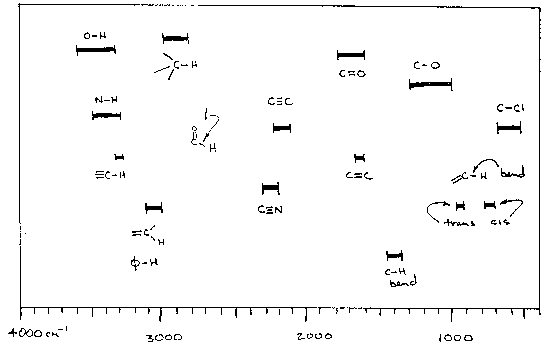
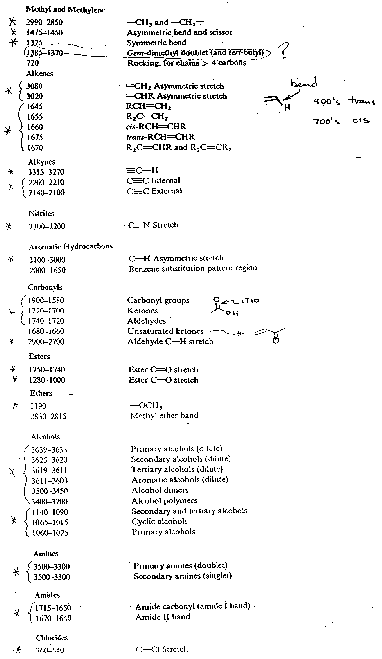
Below are four "cheat sheets" for IR group contributions which you should be familiar with.
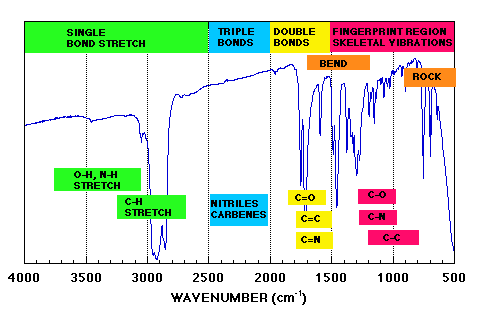
Above From: http://tiger.chm.bris.ac.uk/cm1/RogerEC/welcome.htm (Bristol site above).
(Triple and Double Bond regions are mostly stretches.)
Below: http://chipo.chem.uic.edu/web1/ocol/spec/IRTable.htm (See main site above).
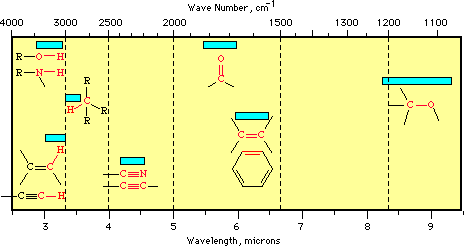
This chart and the following table are from: From: http://chipo.chem.uic.edu/web1/ocol/spec/IRTable.htm (see main site above).
>
* 3700 - 2500 cm-1: X-H stretching (X = C, N, O, S)
* 2300 - 2000 cm-1: CX stretching (X = C or N)
* 1900 - 1500 cm-1: CX stretching (X = C, N, O)
* 1300 - 800 cm-1: C-X stretching (X = C, N, O)
http://chipo.chem.uic.edu/web1/ocol/spec/IRTable.htm (See main site above).
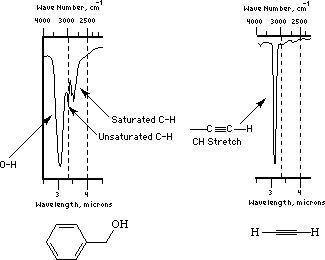
The Following two figures and text are from Paul R. Young's web page, The 4 examples serve to demonstrate the importance of the C-H stretch in identification of organic materials such as polymers.
http://chipo.chem.uic.edu/web1/ocol/spec/IR1.htm
Methylene, -(CH2)-: The spectra of nylon 6-6 above has an example of methylene CH stretch. This is a doublet to the right of 3000cm-1 (lower wavenumber) 2926 (a) 2853(s). A scissors bend is also seen at about 1465cm-1.
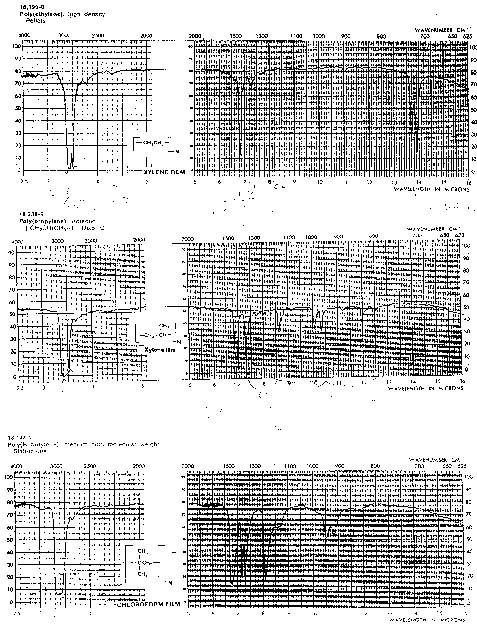
Methyl, -(CH3): Methyl groups (such as in polypropylene, {-(CH2)-(CH(CH3))-}) also display a doublet in the CH stretch region just below 3000cm-1, 2962 (a), 2872 (s). The bend vibration for methyl groups is a doublet (methylene is a singlet), 1450 (a) and 1375 (s). The symmetric bend for a methyl group is called an umbrella bend vibration for obvious reasons. Compare PE, PP and polyisobutylene IR spectra below. You should be able to distinguish these three spectra. Notice the broadening of the CH stretch region due to both methyl and methylene groups in PP an PIB.
Near and between 1400 and 1500 PE has a single peak for the CH bend. For PP and PIB this methylene bend is present also. Below 1400 a doublet appears for PP and PIB indicating methyl bends in asymmetric and symmetric modes.
Other features in the fingerprint region (below 1500) are distinctive for the 3 polymers.
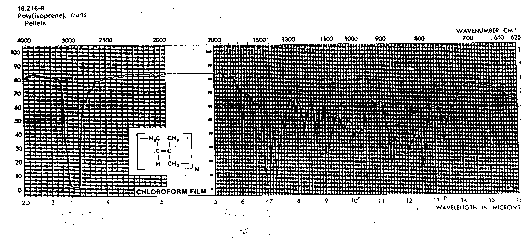
Alkenes, C=CHR: Unsaturation has a signature effect on the CH stretch shifting it to higher wavenumbers, 3020-3080 (to the left of 3000). It is easy to identify unsaturated hydrocarbons in IR by the CH stretch region.
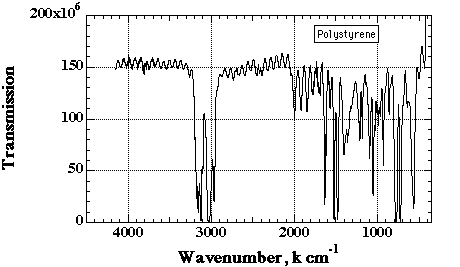
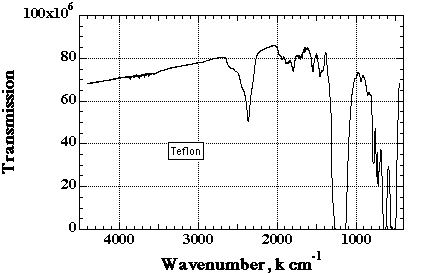
The figure below is an IR transmission spectra for polystyrene -(CH2)-(CH(C6H5))-. The aromatic ring, (C6H5), gives rise to the group of bands above 3010. The bands below 3010 are from the saturated main chain CH groups. Aromatics display a distinctive C=C stretch at about 1600cm-1 which in combination with unsaturated CH stretch above 3000 identifies polymers containing aromatics. The ring breathing vibration at 1600 is always very sharp and strong.
Alkynes, C---C-H (triple bond): As the CC bond becomes stronger the CH stretch vibration goes to higher wave number (3300cm-1 for alkynes). A weak resonance at 2100 to 2200 for the triple bond occurs. The latter bond vibration has a low dipole change so is weak in IR but strong in Raman.
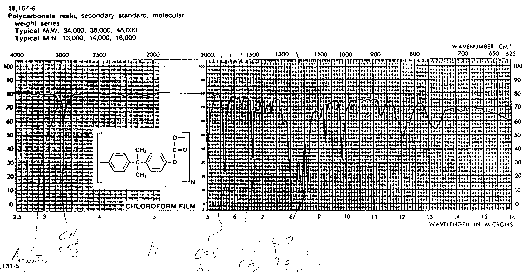
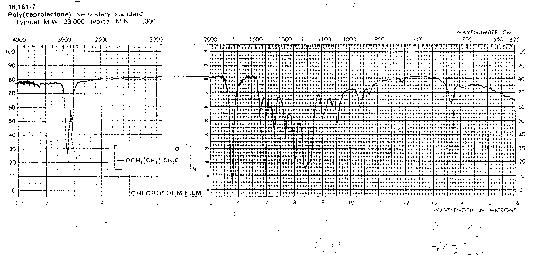
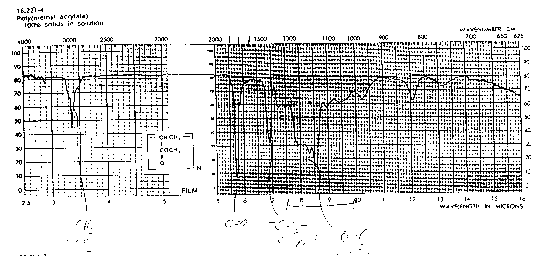
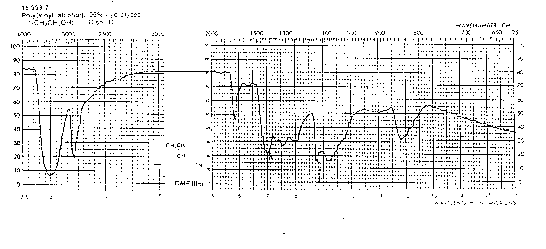
Carbonyl, C=O: The C=O stretch is the most distinctive absorption in IR due to the high change in dipole moment on vibration and the unique range of wavenumber where this vibration occurs, 1700 to 1780cm-1. The carbonyl stretch occurs in many commodity polymers such as polycarbonate, polyvinylacetate, polymethylacrylate and in nylon (see above, IR Raman comparison).
For acetone the C=O stretch occurs at 1724 (CH2O), for aldehydes (R-CH=O) at 1730 and for methyl acetates at 1745cm-1 (R-(C=O)-OCH3). For methyl acetates the O-CH3 stretch occurs at 1100 to 1280cm-1.
You should be able to identify the carbonyl contribution to the following spectra.
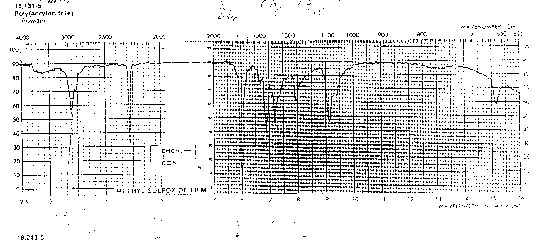
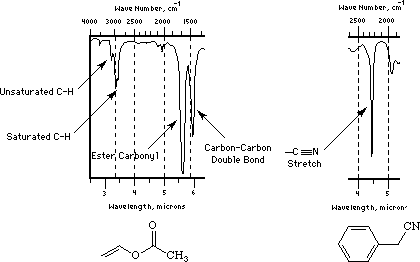
Nitriles, (-C---N) triple bond CN: The CN is a strong absorption band which is seen in polyacrylonitrile (PAN) and copolymers with styrene (styrene acrylonitrile copolymers SAN). The absorption occurs in the 2200 to 2300 cm-1 range.
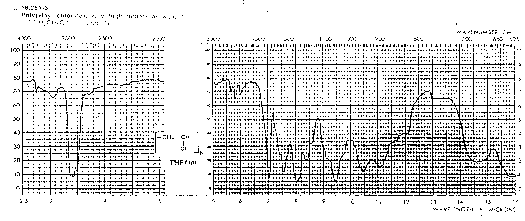
"Saturated and unsaturated CH bands also shown clearly in the spectrum of vinyl acetate (ethenyl ethanoate). This compound also shows a typical ester carbonyl at 1700 cm and a nice example of a carbon-carbon double bond stretch at about 1500 cm. Both of these bands are shifted to slightly lower wave numbers than are typically observed (by about 50 cm) by conjugation involving the vinyl ester group."
Tacticity and Crystallinity:
In some cases it is possible to assign certain absorption bands with tacticity in polymer chains. In most cases only a qualitative measure of tacticity is gained from IR and Raman spectroscopy. Figures 5.13 and 5.18 of Campbell and White and the following figure show the qualitative differences observed in IR/Raman spectra for tactic forms of polypropylene. In some cases specific bands are associated with specific conformations which are possible in tactic forms. Many of these conformational differences disappear when samples are run in the melt. There is a significant overlap between tacticity and crystallinity determinations in IR analysis of polymers.
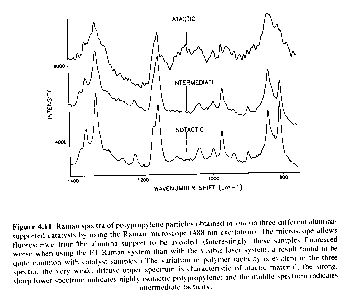
From "Polymer Characterization" by B. J. Hunt and M. I. James, Blackie Press 1993.
Raman spectra form polypropylene particles. Atactic: weak, diffuse Isotactic: sharp and strong. CH3 umbrella bend is to the left.
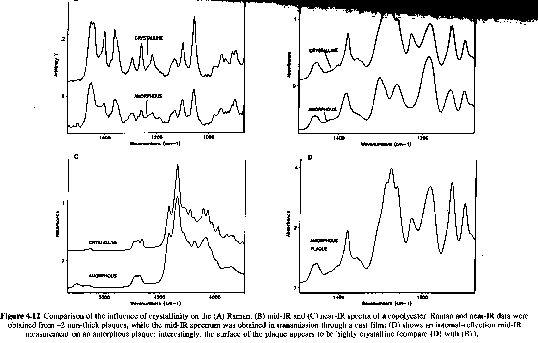
The presence of crystallinity also leads to predictable changes in IR patterns and has been used to qualitatively determine the degree of crystallinity for instance.
LAM Modes in Raman (Crystallite Thickness):
Low frequency regions (< 30cm-1 in polyethylene) have been associated with longitudinal acoustical modes (accordion modes) for the planar zigzag chain conformation in a lamellar crystallite. From the frequency of absorption, the length of such a planar zigzag chain can be determined using a simple model:
![]() From R. G. Snyder, S. J. Krause, J. R. Scherer, J. Pollym. Sci. Polym.
Phys. ED. 16 1593 (1978, where n = 1, 3, 5, 7, 9...
From R. G. Snyder, S. J. Krause, J. R. Scherer, J. Pollym. Sci. Polym.
Phys. ED. 16 1593 (1978, where n = 1, 3, 5, 7, 9...
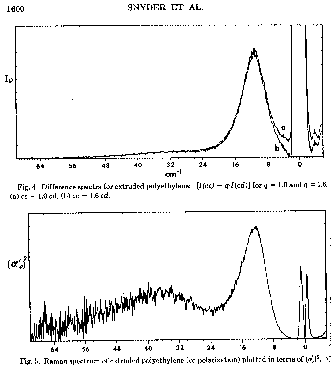
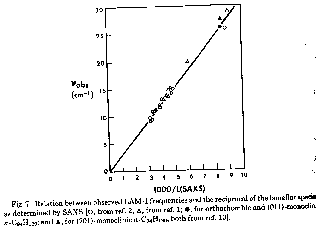
The figure above shows a comparision between the LAM method and the use of small angle x-ray scattering (SAXS) to determing the lamellar thickness. From such a comparison the constants in the LAM equation can be determined. For PE the lamellar thickness, L ~ 6000/[nu].
Orientation:
If polarized radiation is used in IR/Raman it is possible to determine the relative orientation of specific absorbing groups in a processed sample. The usual way to do this is to determine the Herman's Orientation function, f, for the group of interest. f has a value of 0 for unoriented samples, 1 for samples oriented in the machine direction and -1/2 for samples oriented perpendicular to the machine direction but in the plane of observation. The absorption ratio for a given bond is measured by rotating the sample parallel and perpendicular to the incident direction of polarization, R = Aparallel/Aperpendicular. The angle between the bond axis and the polymer chain axis, a, needs to be determined from molecular models if chain orientation is of interest. The orientation function is then given by:
![]()
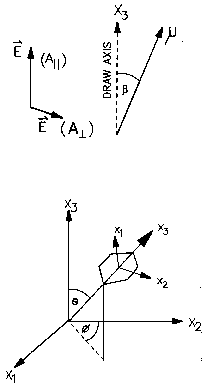
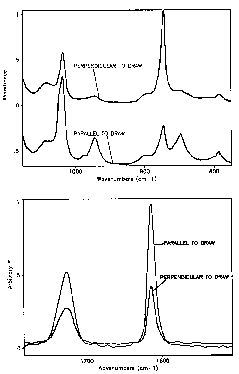
The IR and Raman (lower) patterns below show the type of changes in IR and Raman patterns which are observed for oriented samples of PET.
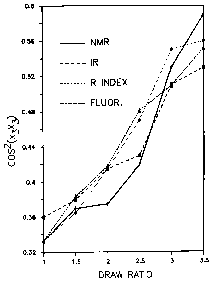
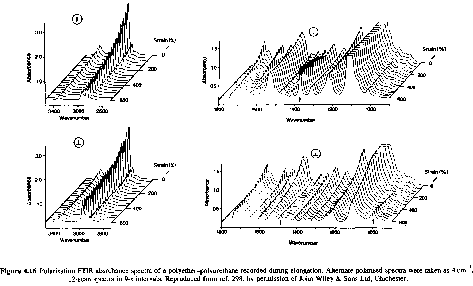
Real time studies of deformation can yield information as to which chemical groups are involved in mechanical manipulation of samples. The following spectra are from continuous deformation of a polyether-polyurethane sample. These show the wealth of information which is available in a rheo-optical study using IR/Raman.
