Project 0.1 Computer program to use time-temperature superposition to shift DMA data
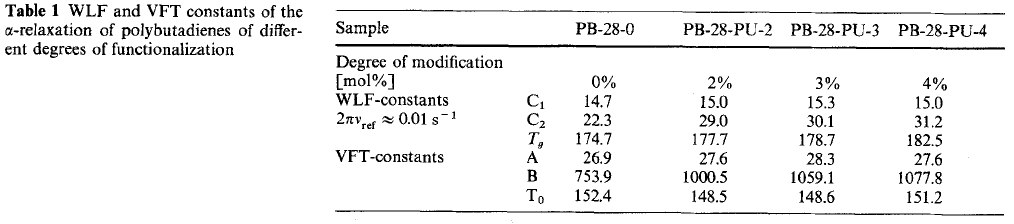
Data for Modulus (E) versus time is given in a tab delimited text file: Data for Polybutadiene. The data is taken at different temperatures and you need to convert this to a master curve using the Williams-Landel-Ferry (WLF) equation. The WLF equation uses three paramters, C1, C2 and T0. The three parameters change depending on the degree of hydrogenation of the polybutadiene (PBD) so a literature set of values (see below) may not be optimum for the PBD you are examining. Start with the WLF parameters shown belowfor PB-28-0 and come up with an optimum set of parameters for this data set.
One way to do this is to write a computer program to calculate the WLF shifted time scales and to plot the curves. The goodness of the parameters is qualitatively judged. (A more analytic method would use the normalized square differences between the curves to determine the goodness of the parameters in terms of a chi square value.) You can use the easiest method as long as you get a qualitatively good set of values for the 3 WLF parameters in terms of the final modulus versus time curve.
Wiki on Time temperature superposition.
Muller M, Kremer F, Stadler R, Fischer EW, Seidel U Colloid Polym. Sci. 273 38-46 (1995). (Use the first column.)