G. R. Strobl, Chapter 5 "The Physics of Polymers, 2'nd Ed." Springer, NY, (1997).
J. Ferry, "Viscoelastic Behavior of Polymers"
Chapter 2: Modes of Relaxation
The concepts presented in chapter 1 are empirical descriptions of phenomena, that is the concept of a primary response function, a time dependent modulus and a time dependent susceptibility do not involve understanding a given material, but are just general functions within which a discussion of the response to perturbation can be considered in a generic sense. To begin to consider the mechanisms of relaxation we can first consider an extremely simple system, a system of molecular-sized dipoles subjected to an electric field. Interactions between the dipoles leads to a retardation of rotation in quantized energy steps. This partial barrier to rotation leads to a finite time of relaxation to the oriented state.
Consider an idealized dipole in a liquid state such as water molecules. The natural polarity of the water molecules is randomly oriented due to thermal motion of the molecules. There is no bulk polarization of the water. When an electric field, E, is applied to the water a preferred direction of orientation of the water-molecule dipoles develops in time. The bulk sample is polarized to an orientational polarization of Por. This orientation represents a balance between 1) the applied electric field times the susceptibility of the molecules to orientation times the number of molecules per volume; and 2) the randomization of dipole orientation caused by thermal motion, 3kT. We have, Por Å {
r p2 E/(3kT)}, where p is the dipole moment of the water molecules and r is the number density of water molecules. The motion of water molecules is considered to be entirely rotational in this case. This value of Por is reached after some length of time and is the predicted equilibrium value.Because there is one simple process involved in the relaxation of water molecules form the strained state to the equilibrium state the relaxation of a simple dipole displays a single relaxation mode. The constraints on relaxation, here interaction between dipoles, slow the relaxation process and lead to a characteristic time associated with the relaxation towards equilibrium. Relaxation of this type is usually associated with an exponential decay function, i.e. the function never reaches equilibrium in a finite time. For this reason, the relaxation time,
t, is taken as the point when 100/e % or 36.8% of the molecules have reached the equilibrium state. t is a natural factor to normalize time for such a process, i.e. t/t is a natural unit to measure time for a given simple relaxation process.Most relaxations in polymers are much more complex than that of a simple dipole responding to an electric field. One way to describe more complex relaxations is to consider multiple relaxation times as will be discussed later.
Single-Time Relaxation Processes:
Consider a creep experiment for a material that displays a single mode of relaxation. A shear stress
s120 is applied at time t = 0 and the strain g12(t) develops with time. We can consider that the application of stress creates a new equilibrium state for the material that is related to the magnitude of stress that is applied, DJ s120, where DJ is called the relaxation strength. The change in strain, dg12(t)/dt, changes with time and reaches 0 when the system is at equilibrium, i.e. where g12(t) = DJ s120. For a linear decay, the rate of change of strain is proportional to the distance from the equilibrium value of strain, dg12(t)/dt = K ( g12(t) - DJ s120), where K will be shown to be (-1/t). The solution to this linear first order differential equation is worked out on the web page http://mathworld.wolfram.com/OrdinaryDifferentialEquationFirst-OrderExact.html . For a function of the type dy/dx + Py = Q, where P and Q are independent of y but can involve x, exp(ºPdx) is the integration factor, m, on this webpage, and the solution is y = exp(º-Pdx) {c + º(exp(ºPdx) Q dx)} where c is a constant that can be solved for the limiting conditions of g = 0 at t=0 or for the t=° limit of g = DJ s120.For this case the solution is given by,
![]()
The relaxation time, t, reflects the order of the time required for the relaxation to occur. The relaxation strength, DJ, is usually difficult to describe as it reflects the response of the system as a whole, i.e. for polarization of a simple molecular dipole, the dipole strength and the coupling of all dipoles in the system that leads to the response.
Consider the application of the simple relaxation model given above to a dynamic mechanical measurement of the dynamic compliance, J*(w). For this case the equilibrium value, DJ s120, in not constant, DJ s12(t), since s12(t) = s120 exp(iwt). Then we have, dg12(t)/dt = (-1/t) ( g12(t) - DJ s120 exp(iwt)). From the previous discussion of dynamic mechanical measurements we know that the resulting strain can be expressed as, g12(t) = s120 J*(w) exp(iwt). By substitution of this expression into the differential equation and solving for the dynamic compliance, J*(w),
![]()
This expression for the dynamic compliance from a simple relaxation is called a "Debye-process". The real and imaginary parts of this complex compliance can be obtained as,
![]()
The imaginary part can be written DJwt/(1 + w2t2) = DJ/{(1/wt)+wt} = DJ/{10-logwt+10logwt} so the function should be symmetric on a linear-log plot of loss compliance versus frequency. Figure 5.5 from Strobl, below, shows such a Debye-process as it would appear in a dynamic mechanical measurement.

The real part of the dynamic compliance shows a steep decay at wt = 1. When the system is probed with times longer than the relaxation time (lower frequency) relaxation is complete and a high compliance (full compliance) is observed. At high frequency (short times) the system can not display relaxation so the compliance goes to 0.
Relationship between the Loss and Storage Compliance for a Debye-Process:
The maximum in the loss curve and the steepest decay in the storage compliance curve both occur at wt = 1 reflecting a relationship between the two processes. This indicates that the derivative of the storage curve may have some relationship to the loss curve or the integral of the loss curve is related to the storage curve. Integration of the equation above for the loss compliance yields,
![]()
so the integral of the loss curve is proportional to the strength of the relaxation. This is a direct result of the Kramers-Kronig relationship discussed in chapter 1, it is "impossible to have a loss compliance without a corresponding (in frequency) change in the storage compliance" (Strobl, p. 208).
Oscillation Or Relaxation:
The total width at half-height for the Debye-process relaxation's loss compliance curve in the figure above is 1.2 decades. This is the lower limit for a relaxation process, that is, more complicated relaxations display a broader loss compliance peak. The loss curve for a simple harmonic oscillator is single valued and a damped harmonic oscillator displays a peak with a half-width much narrower than that of the Debye-process. Then the width of the loss compliance curve can be used to distinguish between a relaxation process and a vibrational process. A fundamental difference between an oscillating system and a relaxing system is that an oscillating system displays a moment of inertia, i.e. it stores energy, while a relaxing system only dissipates energy.
Relations between Relaxation and Retardation Times from McCrum Read Williams p. 105-141
For a single relaxation time process the stress, s(t), and strain, g(t), are related by
![]()
where t is the relaxation time (modulus base). This equation is obtained by the use of a single exponential decay in the Boltzmann superposition equation as described by McCrum p. 104. From this equation the governing equations for creep, stress relaxation and dynamic measurements can be obtained.
For Creep:
![]()
is obtained by simplifying the equation to:
![]()
so P = 1/t and Q = JR/t,
then:
![]()
at t = 0 J(t) = JU, so C = JU - JR. Then,
![]()
For a Dynamic modulus the equation can be reduced to
![]()
![]() and
and ![]()

and for the dynamic compliance we have:

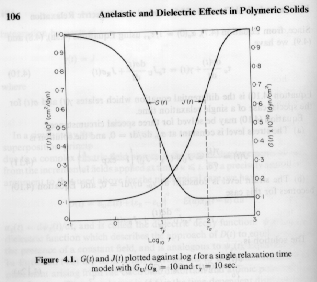
The time dependent compliance and modulus for a single relaxation time material are shown in the figure below. The figure shows that the relaxation time, tG, (modulus) and retardation time, tJ, (compliance) have different values. The equations above can be solved to show that , tG,/tJ = GU/GR = JR/JU.

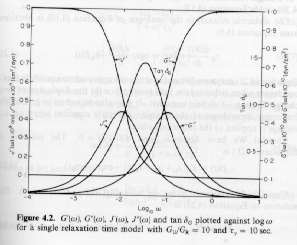
The dynamic compliance, J*, and dynamic modulus, G*, show a parallel difference in relaxation time shown below. The equations above can be used to calculate the loss tangent, tan(d) = G"/G' = J"/J', and the relationship between the peak in the loss tangent (shown below) and the two relaxation times, td = (tG tJ)1/2.

Cole-Cole Plot:
The equation given above for the complex compliance from a Debye-process can be rewritten as the equation for a circle in J'-J"-space, (x-x0)2 + (y-y0)2 = K2. Using the definition of J’ and J" given above we have,

![]()
Then a plot of J" versus J’ for a Debye-process will yield a semi-circle above the J’-axis centered starting at (0,0) for w ->° and ending at (DJ,0), centered on (DJ/2, 0) with a radius of DJ/2. The observation of such a semi-circle indicates that the material displays a Debye-process relaxation.
(A line drawn from the origin to a point on the Cole-Cole plot has an angle with the x-axis of the phase angle, d.)
For a dielectric relaxation the instantaneous electric polarization (like Newtonian flow for the mechanical analogy), eu, is added to De/2 in the left term of the above equation and a similar semi-circle results with the center on the x-axis at De/2 +eu.
![]()
Then the Cole-Cole plot (e" versus e') can be used to directly observe the instantaneous polarization as the starting point of the semi-circle.
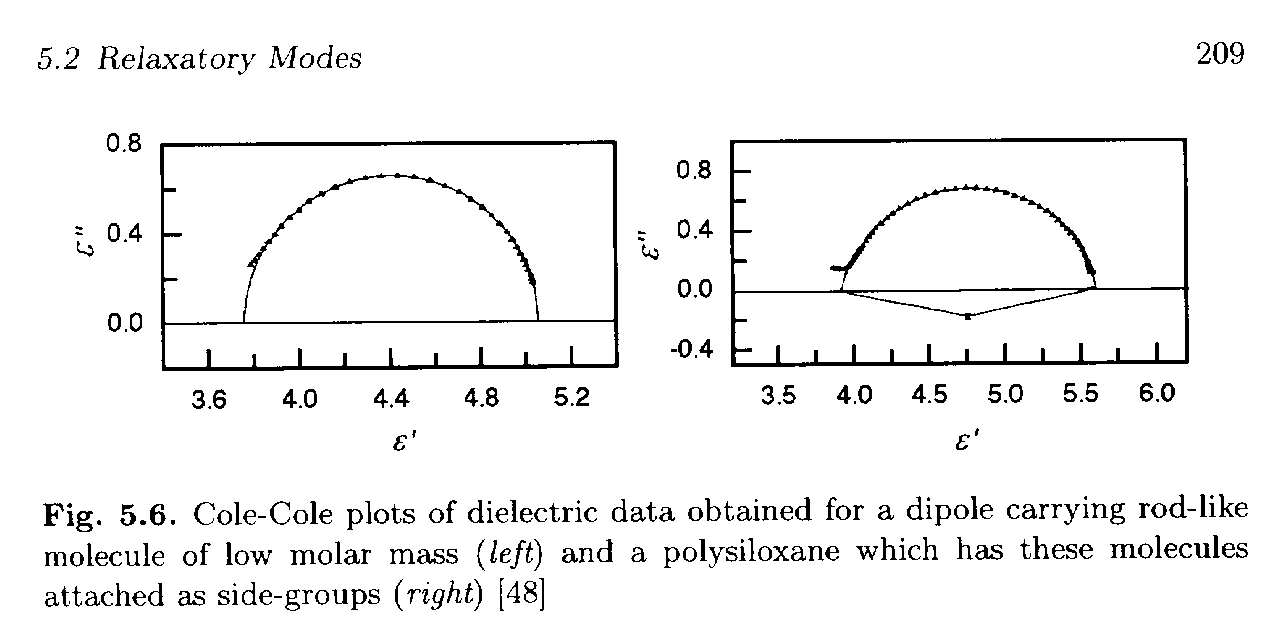
The figure below, Figure 5.6 from Strobl, p. 209, shows some of the behavior and usefulness of the Cole-Cole plot (ref 48 is Seiberle, Stille and Strobl Macro. 23 2008, 1990).

The left curve is for a rod molecule with a strong dipole moment that displays a simple Debye-process relaxation. The instantaneous polarization, eu, is about eu = 3.73 which is determined at the left of the plot (w => ° limit). The right intercept, e' = eu + De, is at about 5.06 so De = 1.33. The peak occurs at about e" = De/2 = 0.67 for e' = eu + De/2 = 4.40.
The right curve is for the same rod-like chemical group attached as a side-group to a polymer chain. For the Debye-process (left curve) we had
e*(wt) = eu + De/(1 + i wt) = eu + De (1 - wt) / {(1 - wt) (1 + i wt)} = eu + De/(1 + w2t2) - iwt De/(1 + w2t2). A comparison between the simple single-valued relaxation time, Debye-process of the left curve and the deviatory process of the right curve include:1) Shift of
eu from 3.73 to about 3.89 (larger instantaneous polarization)2) Shift of De from 1.33 to 1.71 (larger relaxation strength, De)
3) The center of the relaxation circle occurs at e' = 4.75 which remains close to e' = eu + De/2.
4) Peak value is lower than
e" = De/2, e"peak = 0.69 (compare to the expected value of 0.86).Deviations from the Debye-process in the right curve can be modeled by a Cole-Cole Function that includes a scaling parameter,
b, e*(wt) = eu + De/(1 + i wt)1-b, where b =0 for a Debye-process. Expansion of this equation yields a coupling between the imaginary and real relaxation terms, e*(wt) = eu + De(1 - iwt)1-b/(1 + w2t2)1-b.Relaxation Spectra:
It can easily be imagined that a complex relaxing system, such as a polymer material, can display many relaxation times, or many modes of relaxation, each displaying a different relaxation time. A simple way to deal with multiple modes is to consider that a continuous spectrum of relaxation times exist for a given complex material. The dynamic compliance, J*(
w) of a Debye-process is given by,![]()
A linear sum of Debye-processes is the simplest description of a series of relaxation processes each with a strength of relaxation,
DJl and a time constant tl,![]()
This expression can be written as an integral for a continuous strength function, LJ(log t), as,
![]()
where log t is used as the independent variable because of the symmetry of the Debye-process in log wt discussed above. LJ(log t) is called the retardation time spectrum.
For a creep measurement, the strain with time is given by g12(t) = DJs012 (1-exp(-t/t)). The retardation time spectrum, LJ(logt) can be used to describe the creep of a complex material with a relaxation spectrum,
![]()
where Q(t) is 1 for t>0 and 0 for t<0.
Relaxation or Retardation:
The dynamic shear compliance for a Debye-process, J*(w) = Ju + DJ/(1 + iwt)), can be used to calculate the dynamic shear modulus, G*(w) = 1/J*(w), where Ju represents a perfectly elastic spring element in series with a Debye element. By taking the inverse of this expression for J*(w) and substituting Jr = Ju + DJ and t = t Ju/Jr, Gu = 1/Ju, Gr = 1/Jr, and DG = Gu - Gr we have G*(w) = Gu + DG/(1+ iwt). "r" stands for "relaxed" and "u" stands for "unrelaxed" properties. The modulus of the relaxed state is that of the entangled melt and that of the unrelaxed state is that of the glassy polymer for the glass-transition for instance. Then t is much smaller than t. That is the characteristic time for the dynamic shear modulus from the Debye-process, t, is much smaller than the characteristic time for the dynamic shear compliance.
In analogy to the equation for J*(w) and J(t) given above, we can write,
![]()
![]()
HG(logt) is called the relaxation time spectrum for the material.
Relaxation or Retardation Spectra from Data:
To obtain the relaxation time spectrum, HG(logt), or the retardation time spectrum, LJ(logt), from experimental data requires an inversion of the integrals given above. The integrals require a knowledge of all frequencies or all times and are sensitive to truncation errors involved in dynamic mechanical measurements. Despite this these functions have been calculated in a number of cases and the formalism presented provides a framework for the understanding and description of the relaxation of complex materials.