G. R. Strobl, Chapter 5 "The Physics of Polymers, 2'nd Ed." Springer, NY, (1997).
J. Ferry, "Viscoelastic Behavior of Polymers"
R. B. Bird, R. C. Armstrong, O. Hassager, "Dynamics of Polymeric Liquids", Vols 1 and 2, John Wiley and Sons (1977).
Chapter 4: Flow
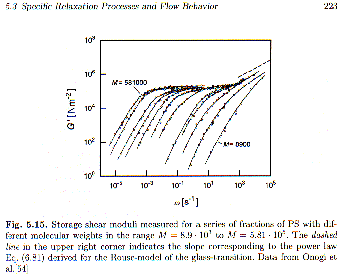
At low frequency the storage shear modulus, G’(
w), follows w2.
If figure 5.15 showed a Newtonian fluid there would be no storage shear modulus, G’, in the flow region (low-frequency regime). For polymeric fluids there is a finite storage modulus even when the material is well into the liquid state. In terms of compliance, J(t), we consider a "recoverable shear compliance", Je0, that reflects elastic behavior in the fluid. Below the entanglement molecular weight, Je0 is observed to increase linearly with molecular weight. Above the entanglement molecular weight Je0 becomes constant, at the plateau shear compliance
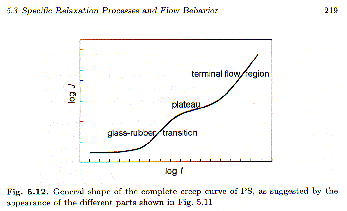
Polymers are generally power-law fluids that display a strong dependence of observed viscosity on rate of strain. At low rates of strain, the viscosity plateaus at the extrapolated, zero shear rate viscosity, h0, that is associated with Je0.
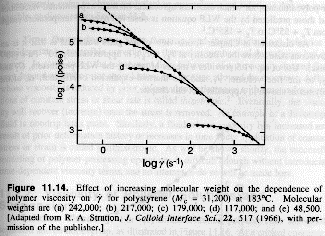
Discussion of the strain rate dependence of the viscosity, shown above, will require the development of theoretical models for polymer flow. Here we are interested in generic descriptions of dynamic phenomena so will focus on the zero shear rate viscosity, h0, and the plateau shear compliance, Je0, specifically, how do these values relate to the primary response function, m(t).
For a Newtonian fluid, sxy = h0 dgxy/dt. If a Newtonian fluid is measured in a dynamic compliance experiment, where, sxy = sxy0 exp(iwt) and g = J*sxy0 exp(iwt). Taking the derivative of the strain and inserting into Newton’s law of viscosity yields,
J* = -i/(h0w)
The Newtonian fluid differs from a polymeric melt in that the Newtonian fluid does not display a recoverable shear compliance, Je0, associated with elasticity of the melt. At the zero-shear rate limit the dynamic compliance for a polymeric fluid is given by,
J*(w=>0) = Je0 - i/(h0w)
Then, the recoverable shear compliance is the real part of the zero shear rate compliance, J’, and the zero-shear rate viscosity is related to the imaginary part of the zero shear rate compliance, J". By taking the inverse of J* we can obtain G* as.
G*(w=>0) = Je0 (wh0)2 + i (wh0)
Then we have well defined power-laws in frequency for G* and J* at the zero shear rate limit (low frequency regime) and the recoverable shear compliance and zero shear rate viscosity are the primary parameters of importance. The w2 dependence is shown in the first plot of this chapter (G' versus w in figure 5.15).
Relationship between h0 and Je0 and the primary response function.
For a deformation with a constant rate of strain, de/dt, the change in strain de (previously dx) = de/dt dt. The Boltzman superposition principle written for the generic time dependent modulus, a(t), is given by:
![]()
and the viscosity, h, is the stress, y(t), divided by the strain rate, de/dt, so the zero shear rate viscosity, h0, (at infinite time, t = °) in a shear experiment where there is no strain before time t=0, is given by,
![]()
The time dependent modulus, a(t) or here G(t), is related to the primary response function by:
m
(t) = dG(t)/dtJe0 can also be related to the time dependent modulus and the primary response function by considering a dynamic mechanical experiment where e(t) = e0 exp(i
wt) and s(t) = G* e(t). Using the above equation for the Boltzman superposition principle:![]()
taking the derivative of the strain, de/dt = i
w exp(iwt) and substituting t" = t-t',![]()
For
w => 0, the exponential can be expanded, exp(-iA) = 1 + A + ...., so,
The first expression can be coupled with the previous expression for G', G' = Je0 (
wh0)2, to yield a description of Je0,![]()
The ratios of the two integrals that define Je0 and h0, yields a time,

This time is called the mean viscoelastic relaxation time. For non-entangled melts (below Me) this time is proportional to the molecular weight squared. For entangled melts it is proportional to the moleculare weight to the 3.4 power. This is because for entangled melts Je0 is constant (plateau) and the time is proportional to the viscosity that increases with a 3.4 power experimentally. Below the entanglement molecular weight both Je0 and the zero shear rate viscosity are proportional to M (as will be discussed later).
Time Temperature Superposition (WLF/Vogel-Fulcher):
It was shown that dynamic mechanical and dielectric data taken in the melt or near the glass-transition temperature at different frequencies as a function of temperature can be "shifted" along the frequency (or temperature) axis to yield a "master-curve". The action of shifting is termed "superpositioning" when the curves coincide to form the final master curve. This observation is called the time-temperature superposition principle, although it is usually applied to frequency. The amount (and direction) that each frequency scan curve (taken at temperature T) is shifted can be tabulated and is given the symbol aT and the name "the shift factor".
aT would appear to be an empirical parameter as presented. Consider the equation for the complex modulus in the "terminal zone" (flow zone) given above, G*(w=>0) = Je0 (wh0)2 + i (wh0); and the equation for the complex compliance in the terminal zone, J*(w=>0) = Je0 - i/(h0w). In both cases the frequency and viscosity appear always as a pair so that the effects of viscosity and frequency can not be experimentally distinguished using complex modulus or complex compliance. Temperature is not directly expressed, however, we know that viscosity is generally a function of temperature in Newtonian fluids, following the Arrhenius exponential law,
h
0(T) = B exp(TA/T) (Newtonian Fluid)where TA is an "activation temperature" associated with the movement of liquid atoms or molecules through gaps created by the free volume of the liquid. This equation is replaced by the Vogel-Fulcher Law for polymeric fluids,
h
0(T) = B exp(TA/{T - TV}) (Vogel-Fulcher Fluid, i.e. polymers)where TV is called the Vogel temperature, and is loosely related to the glass transition temperature (typically TV is 50 C° below Tg). The Vogel temperature implies that there is a discontinuity at some finite temperature where flow can no longer occur. This behavior is associated with the chain-like nature of polymers, and loss of long range mobility lateral to the chain. Strobl's Figure 5.16 demonstrates the validity of the Vogel-Fulcher law both for viscosity and for the a-relaxation time (glass transition) in polyisobutylene. (The Arrhenius law would be flat in this temperature range, i.e. constant viscosity and relaxation time.)

The shift in frequency response at different temperatures is then, solely due to changes in the viscosity as described by the Vogel-Fulcher equation. aT involves the mechanical or dielectric response at two temperatures, the temperature for which the master curve is to be constructed, T0, and the temperature at which the measurement was made, T. The inverse relationship between frequency and viscosity, implied by the presence of h0w as a pair in all terminal relaxation equations, leads directly to a definition of the frequency shift factor in terms of viscosity,
aT = h0(T)/h0(T0) = t(T)/t(T0)
where the proportionality between viscosity and the terminal relaxation time is also shown.
The complex modulus measured at temperature T, can be expressed at temperature T0 using aT as, G*(w, T) = G*(aTw, T0) or, more typically on a log w scale as, G*(log w, T) = G*(log aT+ log w, T0). The time dependent shear modulus is shifted to T0 by, G(t, T) = G(T0, t/aT), or on a log scale, G(log t, T) = G(log t - log aT, T0).
Modes of Relaxation and the Vogel-Fulcher Equation.
Consider that the generic relaxation of a polymer chain involves many different molecular and supramolecular mechanisms, for example, Kuhn segment motion (a physical mer unit of flow), lateral motion of Kuhn segments, chain wise motion of Kuhn segments, various motions of groupings of Kuhn segments, whole chain diffusion, and interactions between chains either physical such as entanglements, or thermodynamic, hydrogen bonding in nylon for instance. Each of these mechanisms can be considered a potential "mode of relaxation". However, despite the complexity and drastic differences in mechanisms for these modes of relaxation, the validity of the time-temperature superposition principle in polymer melts and near the glass transition implies that the time dependence of these modes all depend on the nature of the individual Kuhn segments! This is expressed by a "segmental friction factor" that is temperature dependent. The segmental friction factor will form the basis of most theories of polymer dynamics.
WLF Equation:
The Vogel-Fulcher law can be used to express the shift factor in terms of the temperatures T0 and T,
log aT = -C1(T - T0)/{T - T0 + C2}
where C1 = TA log e /{T0 - TV} Å 14 to 18 and C2 = T0 - TV Å 30 to 70 K°. This expression for the shift factor is called the Williams-Landel-Ferry Equation, WLF-equation.
Dielectric Relaxations in the Terminal Zone:
A fundamental principle of our understanding of polymers is that the mechanical properties are based on molecular structure and dynamics. This means that other analytic techniques that can be tied to molecular structure should mimic the response observed in mechanical measurements. We will later look at the stress optical law and the existence of a constant stress optical coefficient as verification of this principle. Suffice it to say at this point that there is extremely strong experimental evidence that there is a molecular basis for mechanical properties in polymers centered on the Kuhn segment (or dynamic mer-unit). For this reason we might expect to observed relaxations in dynamic dielectric measurements that strongly parallel relaxations observed in dynamic mechanical experiments. The a-transition, at the glass transition temperature, that serves as a boundary between solid and liquid behavior, can be used as a case study of parallel features in dynamic dielectric and dynamic mechanical measurements. Strobl's figure 5.17 shows the frequency and temperature dependence of the loss and storage dielectric constant for polyvinylacetate (PVA) near the a-transition. The behavior is completely analogous to the observation in the dynamic modulus or compliance.
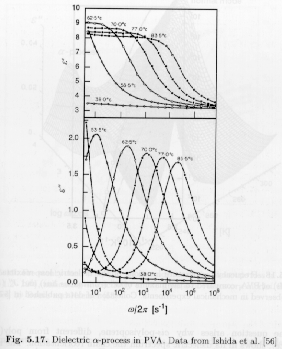
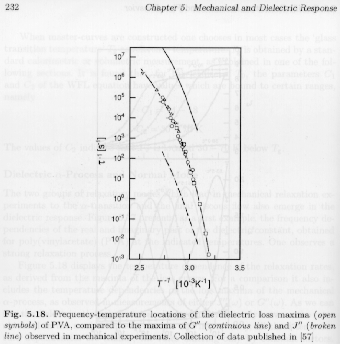
From the maximum in the dielectric loss curve occurs at a frequency that reflects the inverse of the time constant associated with the a-relaxation. This frequency at maximum can be termed the "rate" of the a-relaxation at the indicated temperature. Such a rate of relaxation can also be determined from dynamic modulus (G*) and compliance (J*) measurements. Strobl's figure 5.18 shows that these rates parallel each other but are shifted by a constant, with the dielectric rate observed at an intermediate value between the compliance (higher temperature, lower rate) and modulus (lower temperature and higher rate).
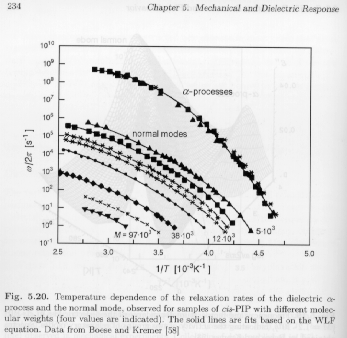
In addition to the a-transition, other molecular based transitions are observed, generally at lower-frequencies compared to the a-transition. Cis-polyisoprene (PIP), for example, shows a prominent normal-mode transition shown as a function of temperature, rate and molecular weight in Strobl's figure 5.20. Most importantly, the normal-mode transition is a strong function of the molecular weight, while the a-transition shows no molecular weight dependence.
The relaxation time associated with the normal-mode transition displays two regimes of power law dependence on molecular weight, as shown in Strobl's figure 5.21.
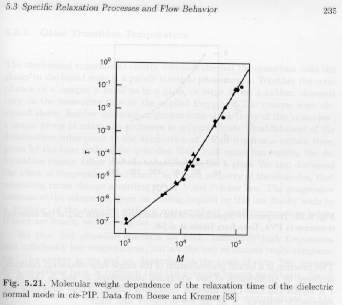
For the low molecular weight (oligomer) regime, the power law is t = M2 and for the high molecular weight (polymer) regime, the power law is t = M3.7. The crossover from oligomer to polymer behavior occurs at about 10,000 g/mole for cis-PIP. This corresponds to the entanglement molecular weight where topological constraints between chains (intertwining or entanglements) dominate the normal mode relaxation.
These molecular weight dependencies are predicted by the simple function presented above,

The mean viscoelastic relaxation time, for non-entangled melts (below Me) is proportional to the molecular weight squared. For entangled melts it is proportional to the molecular weight to the 3.4 power. (For entangled melts Je0 is constant (plateau) and the time is proportional to the viscosity that increases with a 3.4 power experimentally. Below the entanglement molecular weight both Je0 and the zero shear rate viscosity are proportional to M.)
The normal mode relaxation reflects "the time required for a complete conformational reorganization" (Strobl).
If the polymer chain's asymmetry is considered, the basis for and relationship between the a-transition and the normal mode transition can be easily understood. Given that the chain is topologically a one dimensional object, that is, it is connected linearly, we can consider dynamics associated with motion lateral to the chain axis, a-transition, and motions associated with the direction of the chain path. While lateral motion can be associated with basically a single relaxation time, or a simple combination of relaxation times, pathwise relaxations involve a number of different modes associated with different lengths of chain segments. The longer these Kuhn-segment groupings, the slower the relaxation. The fastest pathwise relaxation is associated with a single Kuhn-segment and would have a relaxation time similar to the lateral a-relaxation. The slowest relaxation occurs for the entire chain and is associated with the normal-mode relaxation and involves complete reorganization of the end-to-end vector for the chain. Chain motion along the path can be considered a superposition of these various modes. The analysis of chain pathwise relaxation in terms of modes is the basis of the Rouse and the Reptation models for polymer dynamics. The dielectric normal mode is associated with the lowest order Rouse-mode for oligomers and the lowest order reptation mode for polymers.
Strength of Dielectric Relaxations, De:
The polarization for a chain of freely jointed segments as a function of time after application of an electric field is given by,
P(t) =e0(eu -1) E0 +e0 De(t) E0
![]()
The orientational polarization, Por is related to rN, the number density of dipoles, p, in the electric field E at temperature T. The polymer chain is a chain composed of Kuhn dipoles and the transverse and longitudinal components of the resulting orientational dipole moment are related to the a-process and the normal mode relaxations respectively,
![]() a
a
![]()
where
rs is the number density of Kuhn segments.Since neither the a-process or the normal mode relaxations are well described by a single relaxation time, the Havriliak-Nagami equation is used to describe the frequency dependence of the relaxation strength,
![]()
In a Cole-Cole plot, at the low frequency side (high e'), b1 Å d(log e")/d(log w) and at the high frequency side (low e'), b2 Å - d(log e")/d(log w). Typically, b1 Å 0.5 and b2 Å 0.7 for the a-process and b1 Å 1 and b2 Å 0.4 for the normal mode.
The Glass Transition:
From a dynamics perspective, the glass transition is a kinetic phenomena. That is, if the view of the WLF equation is taken, the properties of a glass could be considered to represent an exceedingly viscous liquid. In fact this is not exactly the case since well below the glass transition temperature a-relaxations are physically prevented through steric interference. That is, at some point tin cooling, a-type relaxations will not occur no matter how long one waits. An alternative interpretation of the glass transition involves the view that it is a second order transition. A second order transition displays a discontinuity in the derivative of the specific volume (1/r) or the enthalpy. Figure 5.24 of Strobl shows the discontinuity in specific volume for polyvinylacetate that occurs at 25 to 30°C.
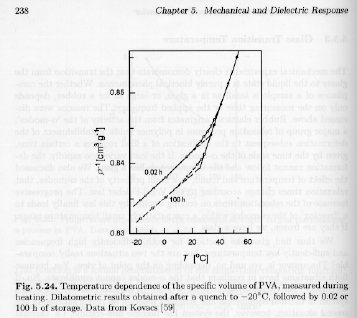
The "physical aging" effect is seen in the two curves of figure 5.24, one of which is a heating run after a short period in the glass and the other after 100 hours in the glass.
Strobl's figure 5.25 shows heating and cooling data from a DSC in the vicinity of Tg showing dH/dT or the heat capacity versus temperature.
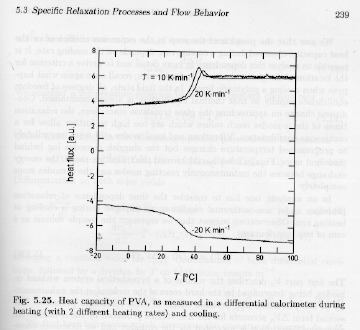
The rate dependence is evident in the top curves.