Chapter 7. Entanglements
The upturn in zero shear rate viscosity versus molecular weight that is prominent on a log-log plot is attributed to the onset of entanglements between chains since it usually occurs at a molecular weight where a number of loops of the chain could possibly occur, about 10,000 g/mole. The mechanical properties of polymers differ above and below this molecular weight, with glassy polymers becoming robust above this value, and usually appearing as a powder below this molecular weight. For semi-crystalline polymers materials are cheesy or waxy below this molecular weight and strong thermoplastics, such as nylon or polyethylene, above this molecular weight. The ability to spin fibers, blow films and perform other normal polymer processing type operations on a material relies on it being above this molecular weight.
Both the elastic and viscous properties of a chain are modified by entanglements as can be seen by the breadth of the spectrum of effects that are observed from dramatic, power-law changes in the viscosity, to completely different mechanical behavior i.e. wax versus polyethylene. Entanglements do not effect properties that depend on local motion of the chain such as the glass transition temperature or a-relaxations. All properties that can be related to the entire chain, normal mode relaxations, are effected by entanglements. Between entanglements the Rouse model works quite well and it can be used, for instance to model relaxations between crosslink points in an elastomer.
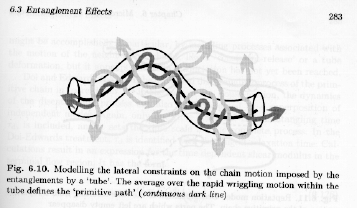
The Rouse model is sufficient for materials below the entanglement molecular weight and as a base model for comparison of polymeric with essentially non-polymeric properties. Above the entanglement molecular weight and for semi-dilute to concentrated solutions modification of the Rouse approach is needed and this is typically done using the tube model or reptation model of Strobl's figure 6.10.

In the tube model the chain retains Rouse like dynamics along a "primitive path", while dynamics are greatly hindered normal to this primitive path due to the formation of a tube of entangled chains through which the polymer chain can be thought to move with a worm like or reptilian motion ("reptation").
Quasi-Elastic Neutron Scattering Measurements:
Evidence for the reptation model comes from quasi-elastic neutron scattering measurements. The reason to go to this rather exotic technique are several fold.
1) By deuterium tagging a single chain in a 3-dimensional entangled mat can be observed.
2) Size resolution on the colloidal to nano-scale is optimal for neutron scattering, 1 to 300Å scales and this lies in the range for a single polymer coil.
3) The time scale for quasi-elastic neutron scattering is on the giga-hertz range that matches that of normal mode relaxation times.
4) The intensity measured is directly related to the time dependent pair correlation function, i.e. the parameter that was calculated for the Rouse chain,
Neutron Scattered Intensity as a function of angle and time = S(q, t) = FT(g(r, t))
where q = 4p/l sin(q/2), FT is the Fourier transform, g(r, t) is the time dependent pair correlation function.
![]()
g(r, t) refers to the correlation of the monomer or Kuhn units in the dilute, tagged chain in an entangled mat.
The quasi-elastic neutron scattering experiment allows one to observe the time correlation of dynamics for a single chain in an entangled mat as a function of both time and distance of correlation. It is expected that as one approaches the smallest scales of size, a Kuhn-unit, that the correlations will drop. By Bragg's law, d = 2p/d, high-q is related to small sizes (Kuhn size) and small-q is related to larger sizes (coil size).
For unrestricted chain motion, as time goes to ° the correlations approach <cm> so we can write,
g(r, t => °) = <cm> (Unrestricted chain motion)
and
S(q, t=> °) = 0 (Unrestricted chain motion)
For confined chains such as chains confined by the reptation tube
g(r, t => °) <cm> (Restricted chain motion)
and this will hold for all sizes (q values) where the chains are confined to a tube. Then measurement of the quasi-elastic neutron scattering pattern can be used to determine the extent of applicability of the Rouse model at small sizes and the effects on dymanics of reptation at larger distances. Strobl's figure 6.8 shows quarielastic neutron scattering data that demonstrates this behavior.
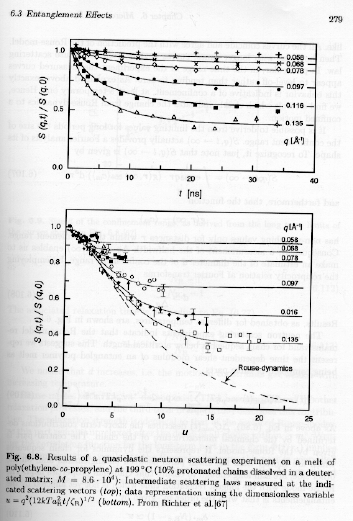
Understanding figure 6.8 requires a bit of background. The series of curves in each plot corresponds to different values of q, or different size scales of observation by Bragg's law, size scale = 2p/q. The highest q's reflect an approach to Rouse dynamics at size scales smaller than that of the entanglements or at size scales where the tube model is not appropriate because the chains have significant lateral motion. At low-q (top curves) significant deviation from the unconstrained motion occurs due to the presence of the reptation tube.
All of the curves in figure 6.8 decay with time indicating an averaging out of the motions with longer times of observation. However, none of the curves approach 0 for unconstrained motion. The parameter "u" in the lower plot is based on Rouse theory. We had for the lowest order Rouse relaxation time,
t
R = ((zR/aR2) N02)/(3kTp2)and through the use of Bragg's law an association between q2 and 1/aR2 can be made so q2aR2 is a dimensionless and reduced q, while t/tR is a dimensionless and reduced time. The parameter "u" depends on both time and q in a natural way and is defined as,
u = q2 (12kT aR2 t/zR)1/2
The use of the parameter "u" should lead to a universal curve for all of the different times and q-values in the top plot. The curves come close to collapsing in this approach. At small-u (short times, the curves approach Rouse-dynamics. At longer times (large-u) the curves deviate from Rouse behavior due to reptation based constraints.
By extrapolating the quasi-elastic neutron scattering measurements on the time domain to t => °, the point of deviation from 0 can be obtained in q, q*, and d* = 1/q* can be calculated as a measure of the size scale of confinement associated with the reptation tube. This is shown in figure 6.9 of Strobl.
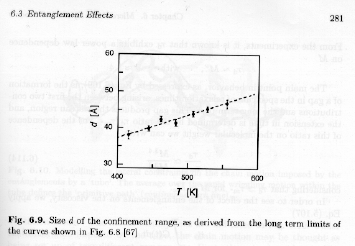
The size scale of confinement has a linear temperature dependence form these measurements, and increases with increasing temperature. As d is the cutoff size for unconstrained motion, increasing d means that constraints are less effective at higher temperatures as might be expected.
This quasi-elastic neutron scattering data indicates that the dynamics of a polymer chain in the entangled melt should be broken down into at least two regimes of behavior, an unconstrained regime at small sizes and a constrained regime at larger sizes. At even smaller scales we expect a third regime associated with the a-processes associated with local chain chemical composition and bonding, DGmic(t). The time dependent shear modulus becomes then,
G(t) = DGmic(t) + rpkT S exp(-2t/tm) + rpkT m* F(t/td)
where the summation is from m = m* to NR - 1, i.e. the high order Rouse modes beyond the critical size scale for entanglements and where m* is associated with the lowest order (largest size) where Rouse dynamics are appropriate. The Rouse regime extends to sizes where the chains are still considered to be Gaussian coils, obeying rubber elasticity on the small end, i.e. to the Kuhn segment size. m* is given by (NR - 1)/(NR,c -1), where NR,c is the contour length in Rouse-units corresponding to the critical molecular weight for entanglements, Mc. The relaxation time tm* is given by tR {(NR,c -1)/(NR - 1)}2.
The third term in the equation for the time dependent modulus reflects dynamics in the confined regime. The expression F(t/td) means that this regime is assume to depend on a single relaxation time, td, that is associated with the time for "disentanglement". F(t/td) is a general normalized function meaning that F(0) = 1. td is the integral width of the arbitrary function, F(t/td), so,
![]()
Empirically (from experiment),
t
d = K M3.4where M is the molar mass of the polymer.
There is a gap in the relaxation behavior between tm*, the longest relaxation time for Rouse behavior, and td, the relaxation time for tube renewal or release of entanglement constraints. This gap in the relaxation spectrum leads to the plateau modulus region. The length of this region in time is reflected by td/tm* Å M3.4/Mc3.4.
The effect of entanglements on the zero shear rate viscosity, h0, can be calculated using the previously derived expression,
![]()
and the expression given above for the three regimes of dynamics in an entangled melt. Ignoring DGmic(t), and using a mean relaxation time, ta, for the Rouse modes that extend up to Mc,
h
0 = rpkT [(NR - m*) ta + M* td]Since m* is associated with the plateau modulus, Gpl, and the NR term is associated with the shortest time relaxations, G(0), the expression can be rewritten,
h
0 = G(0) [(G(0) - Gpl) ta/G(0) + Gpl td/G(0)]The first term in brackets is constant, b1, so,
h
0 = b1 + b2 M3.4At high molecular weights,
h
0 Å td Å b2 M3.4The Reptation Model (Doi and Edwards/ also associated with de Gennes):
Strobl's figure 6.10 shows that the motion of a chain can be considered to consist of two discernable components, the rapid, Rouse components normal to the chain, within the reptation tube, and the slower and discrete (i.e. there is a gap in time) motions in the direction of the reptation tube or the time for the tube to refresh or renew itself (tube renewal time). The path of the reptation tube is termed the "primitive path" for the chain.
The primitive path represents a redefinition of the chain, just as the Rouse-model redefined the chain in terms of rubber elastic units. For the primitive path the redefinition is based on the longest time Rouse mode that reflects unconstrained dynamics. Since the primitive path is the chain, albeit renormalized to the Rouse unit, it displays Gaussian scaling. Then we can write,
R0/aR = NR1/2
where the power 1/2 reflects 1/df and df is the mass-fractal dimension for the chain.
The number of Rouse units in the chain, NR, is related to the length of the primitive path along the contour of the tube, lpr, by,
NR Å aprlpr
where apr reflects the persistence length for the primitive path or the stiffness of the primitive path.
Within the reptation tube the chain thermally diffuses along the primitive path following the Einstein relationship,
D' = kT/zp
where D' is the diffusion coefficient for the chain within the tube along the primitive path, and zp is the friction factor for the chain. By definition there are no entanglements within the tube, so the Rouse result can be used,
z
p = NR zRso,
D' = kT/NR zR
The time for the chain to completely diffuse out of the reptation tube is called the "reptation time", td, as shown in Strobl's figure 6.11 on pp. 284.
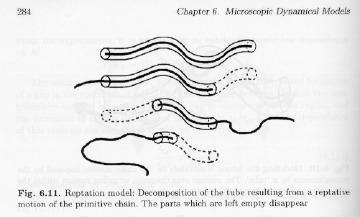
Such random diffusion is governed by laws for Brownian motion so,
t
d = lpr2/D'Using the definitions of lpr, and D', we have,
t
d = zR NR3The reptation model predicts that the relaxation time and the viscosity should scale with the molecular weight to the power 3. The power 3.4 is observed experimentally.
Various modifications to the reptation model have been proposed, most prominent of these is the "constraint-release" approach where some dynamic behavior is introduced to describe the tube itself. These have met limited success.
Strobl's figure 6.12, p. 286, shows results for the measurement of the diffusion coefficient for polymer chains in an entangled melt.
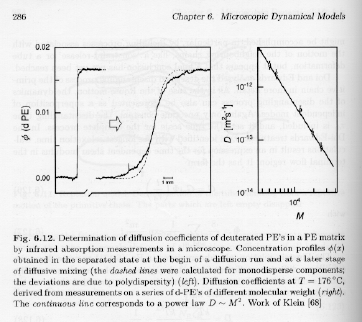
The left graph shows that the diffusion coefficient scaled with M to a power -2. This has been verified in a wide range of entangled polymers. The Rouse model (using the Einstein relationship) indicates that the diffusion coefficient should scale with 1/M,
D = kT/zp = kT/(NRzR) Å 1/M
while the reptation theory correctly predicts the M-2 dependence. This dependence can be obtained by considering motion of the center of mass of the polymer over a distance of the order of lpr, along the primitive path. The mean-squared distance moved, <Drc2>, is given by,
<Drc2> Å R02 = lpr apr
In 3-dimensions the diffusion coefficient is given by,
D = <Drc2>/(6 Dt) = <Drc2>/td Å lpr apr/td Å NR/NR3 Å M-2
The Reptation model correctly predicts the chain dynamics on size-scales of the order of one chain size, i.e. the diffusion coefficient is correctly predicted by reptation in an entangled melt.
Combination of the reptation model and the Rouse model predict a change in the power-law behavior at the entanglement molecular weight of M-1 to M-2 dependence for the diffusion coefficient.
Strobl's figure 6.13 shows a classic experiment (that has been repeated a number of times in the literature) using fluorescently tagged DNA chains (a polyelectrolyte).
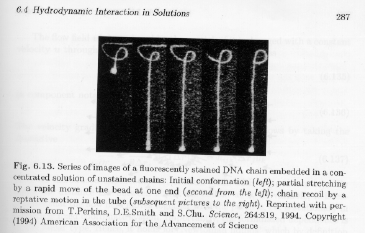
The data shows a time sequence of the dynamics of a DNA chain (a micron-scale biopolymer). The chain is pulled towards the bottom of the figure by the bright spot. These images support the reptation model for obvious reasons.