From L. H. Sperling, "Introduction to Physical Polymer Science, 2'nd Ed."
PDF File: (Click to Down Load): FreeVolandTg.pdf
=> Back to TOC
=> To Syllabus
=> Back to Chapter 1
=> Analysis Chapter 3 Thermal Analysis
Free Volume and Tg
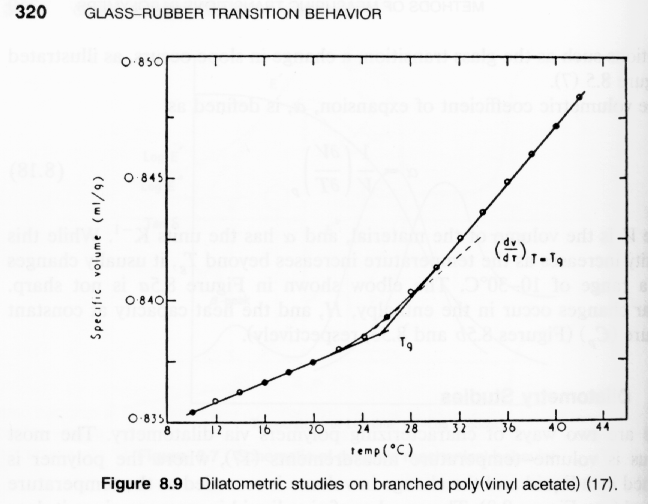
In a plot of volume versus temperature through the glass transition, the thermal expansion goes through a pseudo-second order transition as reflected in a change in the slope. The transition point is the glass transition. The glass transition is sensitive to the rate of cooling as show in the second figure below.
From L. H. Sperling, "Introduction to Physical Polymer Science, 2'nd Ed."
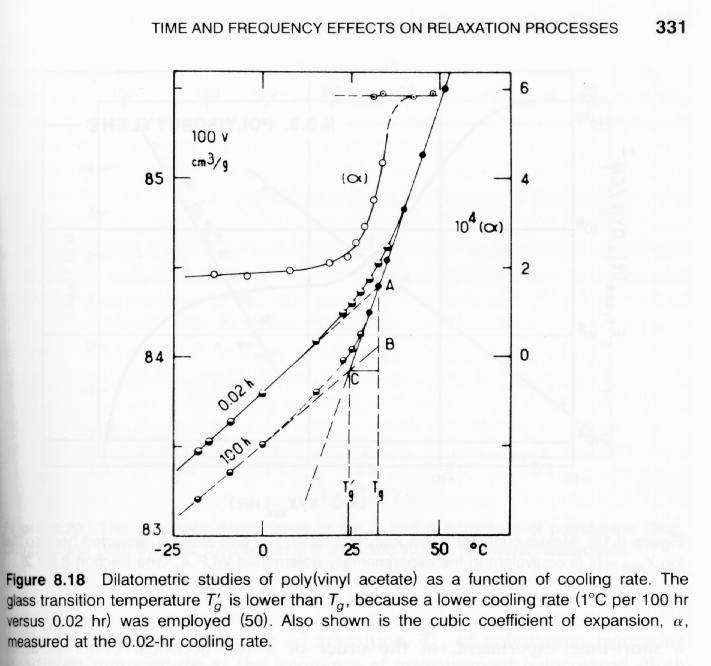
From L. H. Sperling, "Introduction to Physical Polymer Science, 2'nd Ed."
Schematically, we can consider an extension of the cooling curve for the melt (elastomer) regime to low temperatures, below the observed glass transition. If such an extrapolation of measured values was conducted to absolute 0, a difference in volume for a glass and a melt cooled at an infinitely slow rate could be estimated. The extrapolated differences in volume between a glass and the extrapolation of the melt curve is called the free volume. The free volume is associated with the space between molecules in a sample. Eyring (US Nobel Laurete 1950's) was the first to deal with the concept of free volume and it is partly a basis for Eyring rate theories which are exponential rate laws dependent on the ratio of an activation energy and thermal energy in the argument of the exponential. Eyring first postulated that viscosity (and the glass transition) could be described by such activation energies through the use of free volume.
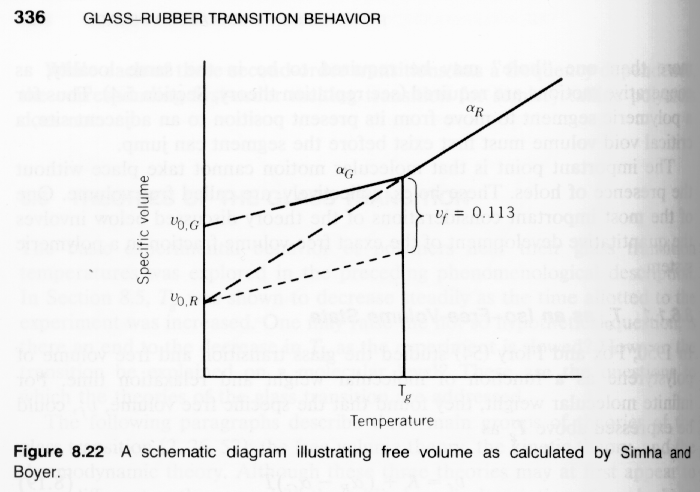
From L. H. Sperling, "Introduction to Physical Polymer Science, 2'nd Ed."
Consider the expansion of a glass from absolute 0 (top curve in above figure at low temperature). It was first postulated (by Flory-Fox and Simha Boyer) that the glass expands at constant free volume, i.e. that glassy expansion, which is much weaker than melt/rubber thermal expansion, involves expansion of the occupied volume of the sample at constant free volume. The occupied volume is the volume actually occupied by the molecules.
This leads to the Simha/Boyer proposition that the glass transition occurs at a constant value of the difference between the thermal expansion of the melt/rubber and the thermal expansion of the glass times the temperature. When this value reaches about 0.113 the glass transition is observed. This means that the glass transition occurs at a fixed value of free volume.
Second, consider the expansion of the extrapolate melt/rubber line from absolute 0. It was postulated that melt/rubber expansion was primarily due to free volume expansion. The thermal expansion of the melt/rubber times the temperature also seems to reach a fixed value at the glass transition of about 0.164. This can be used as a second way to describe the glass transition
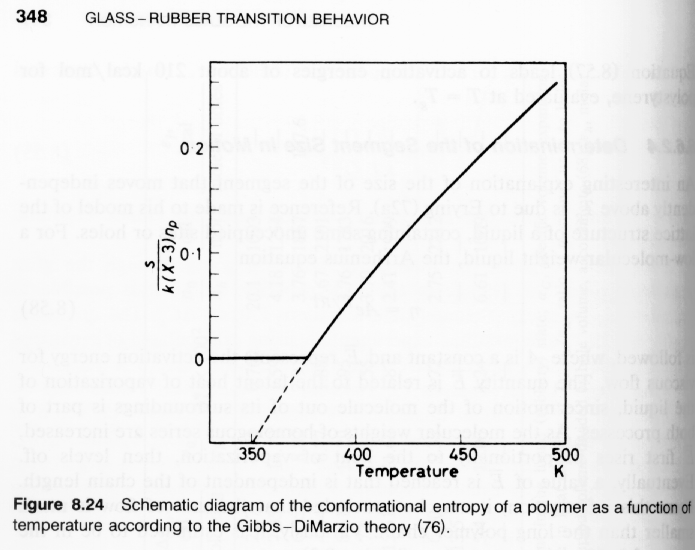
Statistical calculations of the entropy can also be used to determine the basis of the glass transition as was done first by Gibbs and DiMarzio. The entropy of a glass can be calculated from the partition funciton and the dependenc of the entropy with temperature can be used to predict a true second order transition at about 50 degrees below the observed glass transition. There are several problems with the free volume (knetic) approach, especially when compared with the thermodynamic approach of Gibbs-DiMarzio. One is that the kinetic approach predicts a negative entropy as seen in the following plot. This is called the Kautzman paradox. Sperling's book (figure references) and Ferry's book, Viscoelastic Properties of Polymers, are good starting references for theories of the glass transition.
From L. H. Sperling, "Introduction to Physical Polymer Science, 2'nd Ed."
The Williams-Landau-Ferry (WLF) equation for the thermal dependence of the viscosity of polymer melts is an outgrowth of the kinetic theories based on free volume and Eyring rate theory. The probability of motion of molecules per unit time, P, is associated with an Arrhenius relationship involving an Eyring activation energy E and the thermal energy, kT: P = exp(-E/kT). P increases with temperature. The total probability in time "t" is Pt and ln Pt = -E/kT + ln t. If "ln Pt" reaches a specified value for flow, or motion of molecules, then -E/kT + ln t = C, where C is a constant associated with flow (for instance). Then it can be said that ln t = C + E/kT. Here time is inverse to temperature (time temperature superposition).
The activation energy, E, depends on the amount of free volume in a sample, E/kT = B'/f, where f is the fraction free volume and B' is a constant. More free volume is related to a lower activation barrior.
Consider flow at a ground state time, t0, and ground state or reference temperature T0. A "shift factor", aT can be constructed to reflect the difference in ln's of two times associated with two temperatures, t and t0 associated with T and T0, ln aT = ln t - ln t0 = D ln t. The time associated with the shift factor, aT is the time allowed by some experiment. In a flow experiment, the viscosity is proportional to such a time. (i.e. viscosity is inverse to the shear rate in a simple shear experiment.) Then, ln aT = ln(h/h0).
D ln t = B' (1/f - 1/f0) where f0 is the fraction free volume at a reference temperature such as the glass transition temperature and f is the free volume at a temperature of interest. The free volume at a temperatur eof interest, f, is given by free volume theory (above) as f = f0 + af (T - T0). On substitution and rearrangment we have a WLF like equation,
ln aT = -{(B/f0)(T - T0)}/
{f0/af + (T - T0)} = {C1 (T - T0)}/{C2 + (T - T0)}.
C1 and C2 can be calculated from free volume theory or measured experimentally. Both depend on the definition of T0. If ln is replaced with the base 10 log and T0 = Tg then C1 = 17.44 and C2 = 51.6 . These values which are commonly used indicate that the free volume of a glassy polymer at Tg is 2.5% of the total volume.
The WLF equation is one of the most successful results of polymer theory. An example of the power of the WLF approach is shown in the figure below:
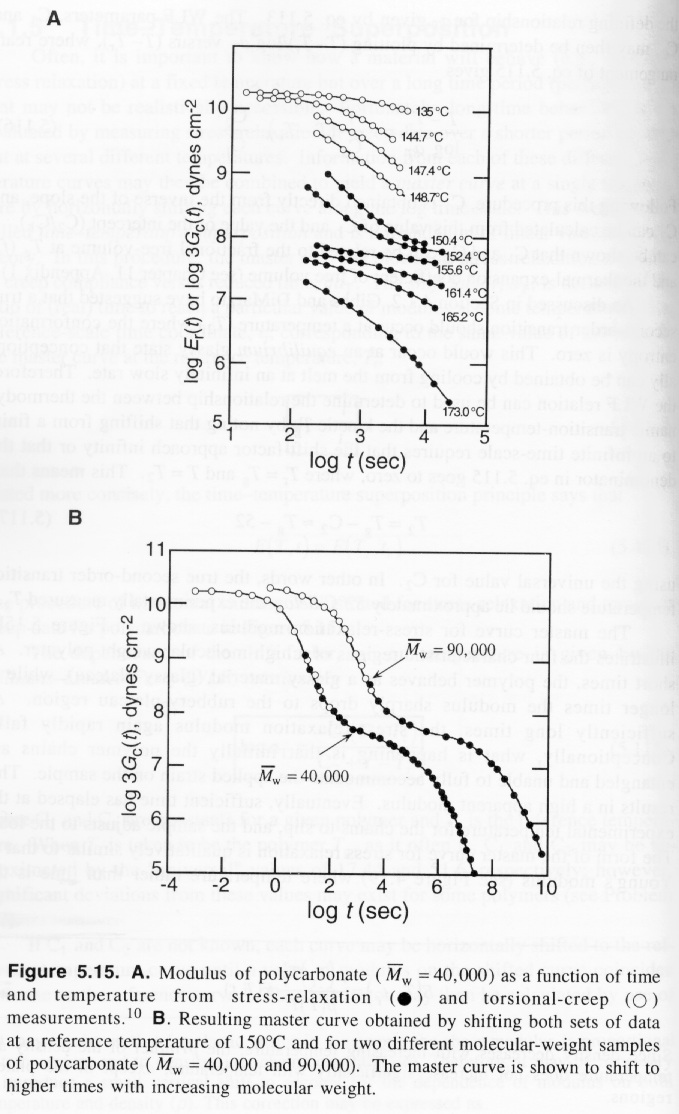
From J. R. Fried, "Polymer Science and Technology"
=> Back to TOC
=> To Syllabus
=> Back to Chapter 1
=> Analysis Chapter 3 Thermal Analysis