Introduction to Rheology
![]()
![[Elastic and sliding components of the displacement caused by shear stress]](rheology_files/image001.jpg)
image: www.lsbu.ac.uk/water/hyrhe.html
Rheology is the study of the flow of materials. In a general sense, all materials flow, even those you may not expect. For those who have looked through a glass window in an older building (say 100+ years), you noticed that the distortion of the view changes as you look from the top to the bottom of the window. This variation is due to the changes in the thickness of the glass which result from it “flowing” over the years…glass windows are a fluid of sorts. To bring the discussion back to terms we are interested in, polymers are very interesting materials…from a rheological point…in the sense that their “time constants” of flow are of the same order of magnitude as their typical processing times. Polymers also exhibit viscoelastic behavior, meaning that at short process times, they act as a solid, and at long process times, they behave as a fluid. This section is dedicated to explaining the basic concepts of rheology, such as viscosity and shear thinning, discussing how process operating conditions, such as shear rate and temperature, and characteristics of the polymer affect rheological properties of the polymer. Both viscosity and extensional systems will be discussed.
Viscosity and Flow of a Fluid under Shear
Viscosity is the resistance to flow, and in general terms, is defined as:

Where
h is the viscosity (in units of Pa*s or lbf*s/ft2),
F is the applied force, A is the area over which the force is applied, v is the
velocity, and x is the distance over which the force is acting. The viscosity
of most polymers vary from 102 – 105 Pa*s A specific
case, and one that is commonly referred to in rheology, is the application of a
shear force, where t is the shear stress
(shear force/shear area) and ![]() is
the shear rate (shear velocity/gap). The viscosity in a shear system is given
by:
is
the shear rate (shear velocity/gap). The viscosity in a shear system is given
by:
![]()
To picture a shear system, on envisions a tube filled with a moving fluid, as shown in the following figure.
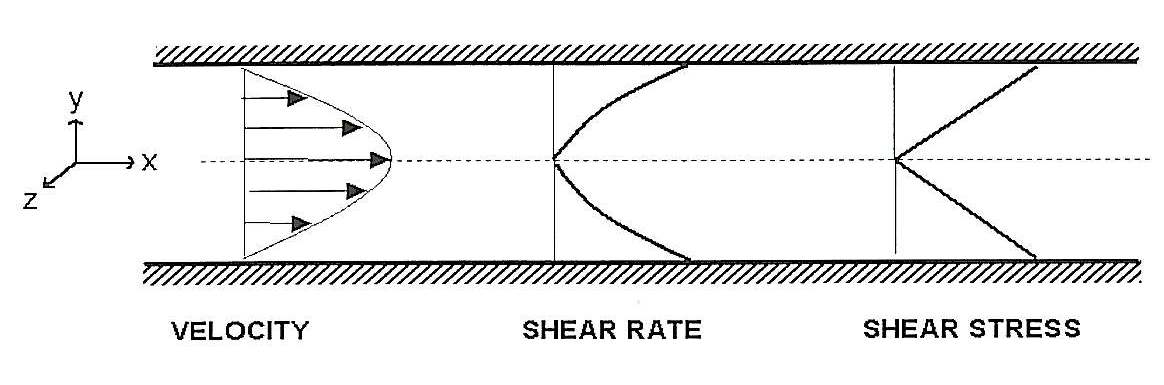
image: Vlachopoulos, J., Strutt, D., The Role of Rheology in Polymer Extrusion, http://www.polydynamics.com/Role_of_Rheology_in_Extrusion.PDF
As you can see, the velocity through the tube has a quasi-parabolic profile, with the maximum velocity along the center line and the minimum velocity at the wall of the tube. The shear stress varies linearly and the shear rate varies non-linearly from zero at the central axis to a maximum at the wall of the tube.
Most polymers non-Newtonian and exhibit an interesting characteristic…their viscosity decreases non-linearly with respect to increasing shear rate. This behavior is called “shear thinning” and is illustrated in the following figure.
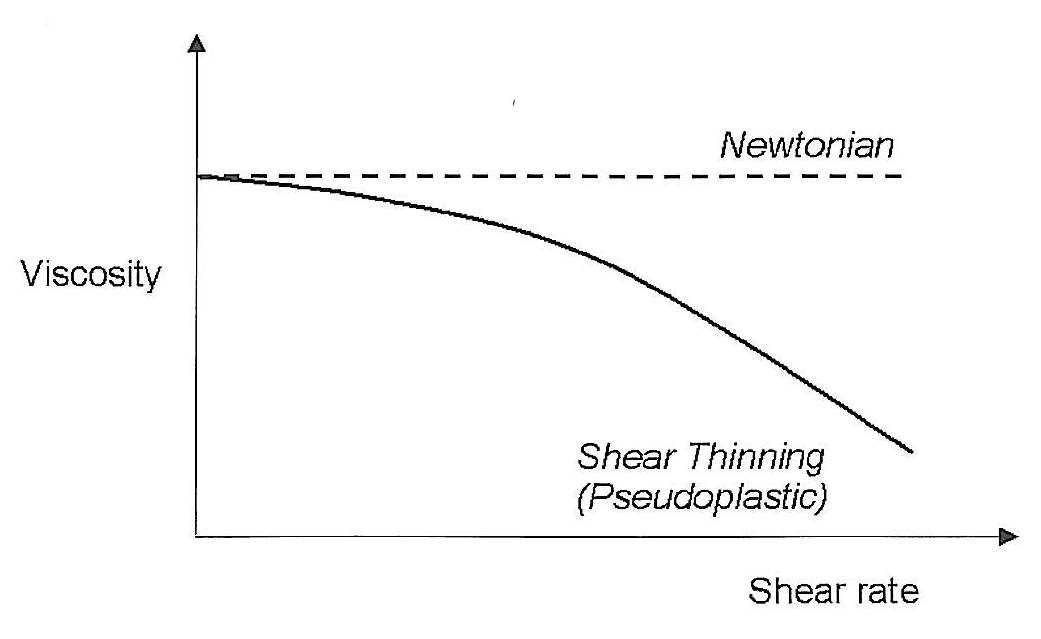
image: Vlachopoulos, J., Strutt, D., The Role of Rheology in Polymer Extrusion, http://www.polydynamics.com/Role_of_Rheology_in_Extrusion.PDF
If the polymer were Newtonian, the viscosity would remain constant at all shear rates. As seen, if we increase the shear rate, which for example can be done by increasing the rpms of an extruder, we see the viscosity becomes lower, meaning there is less of a resistance to flow. This reduction in viscosity is due to the molecular alignment and disentanglements of the long polymer chains. As you can see, the conditions of a process are closely intertwined with the properties of the polymer. By increasing the shear rate through a die, say be closing the die gap while keeping the volumetric flow rate constant, the polymer flows easier to more evenly fill molds, such as with injection molding. Some typical shear rates for polymer processing are:
|
Process |
Shear Rate (s-1) |
|
Single screw extrusion (in screw channel near the barrel wall) |
200 |
|
Lip of flat dies (as in cast film) |
1000 |
Caution must be taken when designing equipment for polymer processing. If the shear rate is too low, say through a die, “hang ups” of the material can occur, resulting in gels or contamination in a polymer film. Typically, a die is designed to have a minimum shear rate of 10 s-1 at the die to prevent such issues. In addition, too high of a shear rate can cause flow issues, such as “shark skin” (surface roughness) or melt fracture (evident by chevron marks). The cited references in the General Polymer Modeling section on the Reference page of this web site give a deeper understanding to the cause of these flow instabilities.
The viscosity is typically measured via a rheometer of sorts. The two most common types are a dynamic (plate-plate, cone-plate, etc) or capillary rheometer. The intent of this page is not to discuss measurement methods, but to provide insight into rheological models and their application into modeling a polymer process. For further information regarding testing procedures and calculations, the reader is referred to ASTM D 3835 (capillary) and ASTM D 4440 (dynamic).
There have been several models developed that can be used to determine the viscosity of a polymer relative to shear rate. The simplest, and most commonly seen, is the power law model, which states:
![]()
Where m is the consistency and n is the power law constant. For the limiting case where n=1, the fluid is Newtonian with a viscosity remaining constant with respect to the shear rate and having a value equal to m. Smaller values of n are indicative of polymers that have a greater tendency to shear thin. The power law constant (n) for polymers typically ranges from 0.8 (higher modulus) to 0.2 (lower modulus). The consistency typically has values ranging from 103 (lower modulus) - 105 (higher modulus) Pa*s.
Approximate values of both m and n can be determined from two different melt indices. The melt index is simply the amount (in grams) of polymer that passes through a heated die of specific temperature under a specific load for a specific time. Details are given in ASTM D 1238-04c. To approximate m and n, we use melt indices determined with the same die size and temperature, but with different loads. We will note the lower load as “LL” and the heavy load as “HL”, with their respective melt indices as “MI” and “HLMI”. The following equations are used to approximate m and n:
![]()

Where r is the density of the polymer at the temperature at which the testing was conducted.
The power law model is relatively good at predicting viscosity values at high shear rates, but is rather poor at predicting viscosity values at low shear rates, since the viscosity goes to infinity as the shear rate goes to zero.
There are two other models, the Carreau-Yasuda and the Cross models, that give a better fit over the entire shear rate range, but require the use of fitting parameters (a, l, n). The following equations represent each model:


Where h0 is the viscosity at zero shear rate.
The viscosity of a polymer varies exponentially with temperature by the following equation:
![]()
Where href is the viscosity of the polymer at a reference temperature and DT is the difference between the desired temperature and the reference temperature. The temperature sensitivity coefficient (b) typically ranges from 0.01 – 0.1 °C, and for most polyolefins, b is equal to 0.015 °C.
The characteristics of the polymer greatly affect its rheological properties. The following figure shows the relationship between the viscosity of the polymer and shear rate, as affected by characteristics of the polymer.
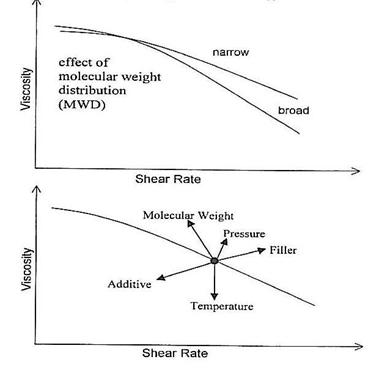
image: Vlachopoulos, J., Strutt, D., The Role of Rheology in Polymer Extrusion, http://www.polydynamics.com/Role_of_Rheology_in_Extrusion.PDF
Polymers with narrower molecular weight distributions, less branching, containing fillers, and higher molecular weights have higher viscosity values. In general, the viscosity of a polymer is related to the weight average molecular weight by:
![]()
The resistance that a fluid has to extend is known as its extensional viscosity. The viscoelastic nature of polymers allow them to be stretched…a requirement for many commercial processes. Trouton was one of the first to explore this phenomenon, and determined the following relationship between the extensional viscosity (he) and the shear viscosity (h):
![]()
This ratio, appropriately named the Trouton ratio, is valid only for Newtonian fluids. This means for a typical polymer that exhibits shear thinning, this ratio is only valid at very low shear rates. For further reading, a theoretical derivation of the Trouton ratio is clearly presented in Tadmor and Gogos (p. 186-187).
Cogswell developed a method of determining the extensional viscosity at a given extensional rate, based on the understanding that the excess pressure encountered in the flow of a fluid from a large reservoir to a smaller diameter capillary is due to the material’s extensional viscosity. Based on his model, the extensional viscosity is calculated by:

At the following extension rate:

The comparison of the shear and extensional viscosities of LLDPE and LDPE present and interesting discussion. In shear, the linear, narrower molecular weight distribution LLDPE is stiffer than the branched, broader molecular weight distribution LDPE. This is due to the fact that in extension, the linear chains of the LLDPE slide past one another, while the branched chains of the LDPE become entangled, and thus resist extension. This characteristic correlates to the real world experience of LDPE having better “melt strength…a.k.a. bubble stability” than LLDPE in the blown film process. Commercially, film producers will blend 10-15% of LDPE into LLDPE to improve the bubble stability of their film blowing process.