=>Back To Characterization Lab
Download this page: =>Lab 3.pdf
_____Download Data:
__________UHMWPE.gif
__________Azimuthal Averaged Data.MSExcel
__________Radial Averaged Data.MSExcel
XRD of Polymers
Objective:
The objective of this lab is to become familiar with the use of x-ray diffraction in polymer analysis. The emphasis is on the difference between XRD in polymers and XRD in metals and ceramics. The main uses in polymers are:
1) determination of unit cell type and lattice parameters
2) determination of the degree of crystallinity (DOC)
3) determination of the microstructure through the Scherrer equation
4) determination of crystallographic orientation through pole figures and the Hermans orientation function
The department does not own a transmission diffractometer which is the most useful for polymer analysis. Several Statton photographic cameras as well as a reflection geometry spectrometer (designed for metals and ceramics) are available. We also have access to Image plate based diffractometers at Wright Labs and Procter & Gamble whose data will be used in this lab for construction of a pole figure and calculation of the Hermans orientation function.
Note: The prerequisites for this course require some knowledge of XRD equivalent to an undergraduate course and lab in XRD, a course on analytic techniques as well as an introductory course on polymers. Please see texts by Cullity, Alexander, Vonk, and Schultz for descriptions of XRD in polymeric systems.
Instruments to be used:
Phillips Diffractometer (Departmental)
Departmental Statton Cameras with Polaroid Film (Departmental)
Image plate diffractometer (P&G and Wright Labs by special arrangement)
Materials:
Blown films of HDPE, LDPE , LLDPE, Exxon Exceed Resin (Metallocene) and some blends. You can add other polymers studied in this course such as polyhydoxybutyrate or PMMA samples.
Procedure:
1) Take photographic diffraction patterns on the Statton camera for all samples noting the machine direction for blown films on the photograph.
2) Use the Statton photographs as a guide for several diffractometer scans for each sample.
3) Obtain diffractometer scans for samples which have been stretched to different extents.
3) Obtain image plate, azimuthal averaged and radial averaged data from several oriented polymer samples.
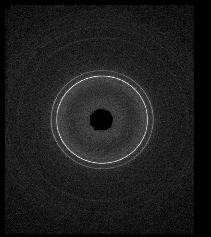
One data set from a processed sample of ultra-high molecular weight polyethylene has been measured using an image plate detector, UHMWPE.gif. This 2-d data set was "azimuthally" averaged, meaning the the intensity at each value of 2-Theta from the center was summed around the center and normalized by the number of channels and 1/r2. The 1-d plot that results, Azimuthal Averaged Data.MSExcel, is similar to a 1-d scan on the departmental diffractometer.
Information pertaining to orientation in the plane perpendicular to the incident beam is available from such a 2-d image by "radial" averages at a fixed value of 2-theta, Radial Averaged Data.MSExcel. These radial averages involve the variation in intensity for a given diffraction peak about the center of the 2-d image from 0 degrees at the top center of the 2-d pattern to 360 degrees. The radial data can be used to calculate the Herman's orientation function for a given reflection. Calculation fo the Herman's orientation function is described in XRD.html
Analysis:
1) Determine unit cell type and identify all reflections in the samples studied.
2) Calculate lattice parameters for all samples
3) Construct a plot of unit cell dimensions, a, b, c, as a function of elongation for stretched films.
4) Determine the degree of crystallinity (DOC) for all samples.
5) From the diffractometer traces and the image plate data determine the lamellar thickness in the plane normal direction using the Scherrer equation
6) From these values calculate the lamellar thickness and approximate the melting point using the Gibbs-Thompson equation (Hoffman-Lauritzen equation).
7) From the image plate radial average data calculate the Hermans orientation function for several reflections.
8) Using these values calculate the orientation function for the unit cell directions and demonstrate that for orthogonal unit cells the sum of these orientation functions is close to 0.
9) Construct a pole figure for one reflection using the image plate data.
Questions:
1) How do your lattice parameters compare with literature values?
2) How do you think the degree of crystallinity measured in diffraction would compare with that measured in a density gradient column?
3) Explain why the breadth of a diffraction peak might be related to the thickness of lamellae?
4) How could micron scale grained inorganics such as silica be identified in a commercial PE sample by diffraction? Is there any evidence for inorganics in the PE samples you studied?
5) Describe the qualitative difference between an oriented and an unoriented 2-d diffraction pattern.
6) Why are pole figures used for processed polymer samples while Wulff nets are used for single crystal samples such as a silicon boul (sp?)?
7) Explain why the Hermans orientation function and some unit cell parameters change with strain.
8) Why do some unit cell parameters change dramatically with strain while others remain fairly unchanged?