Polymer Processing Lab 2
Mixing of Thermoplastics and Additives.
Download data for Mixing Lab (Tina's)
Objectives: To become familiar with a small-scale mixing operation.
Background:
Middleman: Chapter 12, Laminar Shear Mixing Section 12-3, Stirred Tank Section 12-6.
Tadmor: Tadmor Chapter 7, pp. 196
describes the concepts important to mixing and Chapter 11, pp. 405 and section 11.9 on pp. 447 describes simple batch mixers. Figure 11.1, pp. 406,
shows a processing-scale version of the lab-scale Banbury mixer (Figure 11.24 pp. 448)
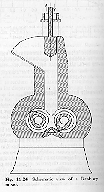
which will be used in this lab. The flow in such a mixer is laminar and the mixing operation involves increase in the interfacial area between two liquid phases if mixing of a polymer additive such as a color concentrate is considered. A color concentrate is a premixed dispersant in the same polymer as used for the process. For mixing of a filler material such as carbon black, especially at early stages when the polymer pellets have not yet melted, the mixer can be considered dispersive. Tadmor Chapter 7 and Middleman Chapter 12 describe the difference between lamellar mixing and dispersive mixing. Banbury mixers are often modeled with a simple flow geometry based on concentric cylinders as in Tadmor example 11.2 on pp. 417, Tadmor example 11.7 on pp. 449, and in several other places in Tadmor, particularly in chapter 7 as well as in Middleman Chapter 12.
Tadmor describes the adjustable parameters for a Banbury mixer on pp. 449,
Temperature, this varies through the process and should be monitored during mixing
Mixing Time, this should be recorded for a mixing operation
Feeding schedule of additives
- dump mixing, all added at once
- upside down mixing, add solids first then polymer
- seeding, add small amount of premixed batch to start-up mixing process.
Common Problems which occur in a Banbury Mixer are:
Parameters measured in a typical mixing operation:
- Torque as a function of time, this typically reaches a maximum rapidly and then dissipates to a plateau value when mixing is complete
- Temperature, increases and reaches a steady-state value.
- Observation of "goodness of mixing" and laminar flow profile for mixing of two phases.
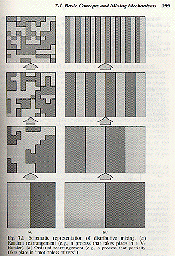
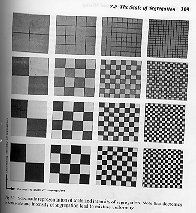
Tadmor Figure 7.1 pp. 199 (above), shows what is meant by distributive mixing for a random (particulate dispersion) and ordered (laminar flow of fluid elements). In both cases the two components are "mixed" but the resulting mixtures are distinguishable. The scale of segregation in a mixture is one measure of how "good" the mixing operation is. The intensity of segregation is another. Tadmor Figure 7.7 on pp. 209 (above) demonstrates the meaning of these two measures of "goodness of mixing". Since mixing is a statistical operation, one naturally uses statistics to describe mixing. This leads directly to functions which describe the correlation of phases in a mixture (Tadmor section 7.5 pp. 211 and Middleman Chapter 12).
It is usually desirable to know the cumulative strain which the mixture has been subjected to in a statistical sense. This is related to the flow profile and the residence time of fluid elements. We will discuss these issues in class as they are fairly involved (Tadmor Chapter 7 pp. 225 to 234 and MIddleman Chapter 12). They will also be considered with respect to the simpler flow geometry of the single screw extruder in a later lab.
For this lab an estimate of the scale of segregation will be made at several stages of a mixing operation. The torque will be recorded as a function of time and the temperature will be monitored through the mixing process.
Required Analysis:
- Separate plots of Torque versus time and Temperature versus Time. All Torque runs should be plotted on a single graph and data sets on the same conditions should be combined. Same for Temperature plots. (You may need to use old data for this.)
- On these plots you need to mark where features seen in the samples occur, i.e. you have to correlate the sample's state of mixing to the Temperature and the Torque so you can understand the Torque and Temperature curves!
- Make sure you note where dispersive mixing occurs, melting occurs, laminar mixing occurs and where the mixture is completely mixed.
- You will have to make a plot of the scale of segregation versus time from the samples by estimating the size of the dilute phase. This curve should start at the pellet size if a color concentrate is used and should progress to the width of lamellar streaks as mixing progresses and should end at a size below resolution when the sample is mixed.
Questions:
- Middleman Problem 12.1
- Middleman Problem 12.2
- Middleman Problem 12.4
- Middleman Problem 12.10
- How is the torque versus time curve related to "completion" of the mixing operation? (use old data if necessary)
- How is the temperature versus time curve related to "completion" of the operation?
- Discuss the appearance of the mixture at various stages of mixing. How is this appearance related to #3 and #4 above. Estimate the size of an average domain in the mixture and plot this versus mixing time.
- Define the terms given below.
Your lab report should include a description of the mixer including model number and brand, description of the resins including source and melt index, a description of the other components which were mixed, copies of your lab notebook describing the samples which were made and the processing conditions. Please follow the rules for lab reports and rules for lab notebooks which are in separate handouts.
NOTES:
Gross Uniformity, texture, scale of examination (how good is good enough?), random mixing versus a pattern
Statistical analysis, first order (composition), second order (distribution), random involves clustering (Tadmor figure 7.3)
Statistical analysis will involve a correlation function whose integral will be a scale of segregation. Tadmor pp. 209.
Residence time, residence time distribution.
We will mix HDPE with black concentrate. 2 mixer speeds. Have to measure torque crudely but should work. 400°F = 204°C (run at about 200°C)
Measure torque with ruler by motor motion (best we can do for now). Watch Temperature (usually doesn't change much for this operation.)
The idea is to run the mixer until mixture is uniform at some speed. Then re do run for half time twice and compare result. If we can obtain a peak in torque then we will correlate mixing to position in torque curve. DESIGNATE a recorder of the time and torque, a measurer of torque and someone to add the materials.
If there is enough time we can do two speeds and perhaps another resin, we have PS.
Black is in a ps/pbd carrier resin and is about a 60 to 70% concentrate.