X-Ray Diffraction Lab
Lab 6: Diffractometer/Phase Analysis & Composition
Copper Wire (oriented), Copper Plate (unoriented), Zinc Powder, Brass Key, Moly Powder, Moly/Copper Powder
(Same file in xls format)
Objective: To become familiar with use of the diffractometer for quantitative analysis of phases in mixtures/alloys of metals.
Background:
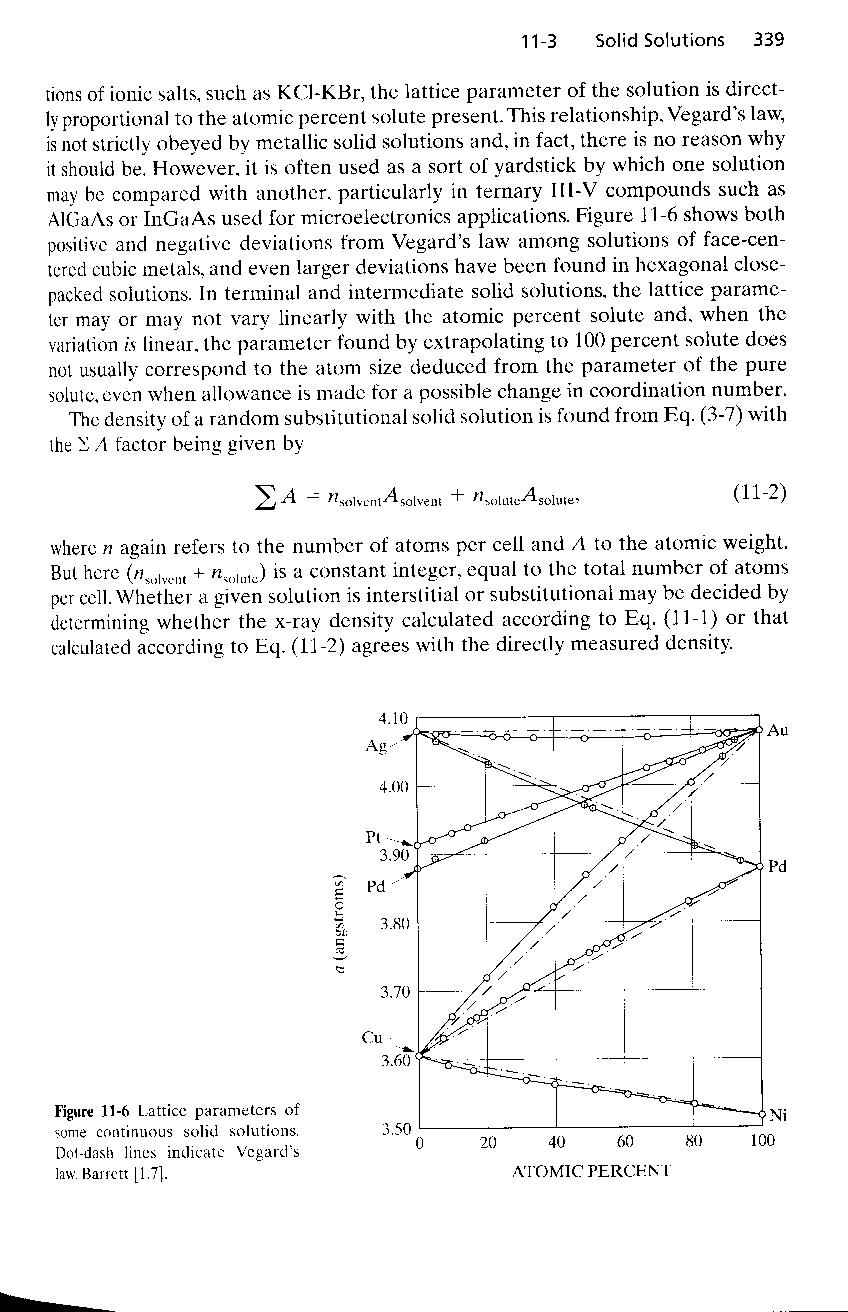
New Cullity and Stock: Chapter 11, Figure 11-6, Chapter 12 (Phase
Analysis), Chapter 6 (Diffractometer), Chapter 4 (Calculated Diffracted Intensity)
Old Cullity: Chapter 12 Fig. 12-6, Chapter 14 (Phase Analysis), Chapter 7 (Diffractometer), pp. 139 section 4-12 and equation 4-21 for Diffractometer.
This lab will involve the analysis of composition of two samples, a brass key , composed of a substitutional solution of zinc in copper (FCC); and a physical mixture of copper (FCC) and molybdenum (BCC) powder. In the brass key
Vegard's Law will be used to determine the zinc content by consideration of the shift in the lattice parameter for the FCC pattern. In the powder mixture a calculation of the relative intensity of two peaks will be used to determine the amount of BCC Moly and FCC copper in a mixture containing independent crystals of these two materials.
Zinc Content of Brass
Procedure:
- Measure the diffractometer trace for copper and zinc
(probably done last week).
- Index both crystal structures and determine the lattice parameters
(probably done last week).
- Determine the distance of approach for the two patterns (for HCP this is "a", for FCC this is "a"/
√(2)
) See Crystal Structures of
MetalsMake a plot of closest approach distance versus number fraction zinc, at 0 this is the distance for pure copper determined above and at 1.0 this is the number determined above for copper.
Vegard's Law predicts a straight line for this plot for brass
solid solutions, draw this line.
From the FCC brass structure determine the distance of closest approach and find the number fraction zinc in the brass key.
Cu/Mo Powder Mixtures
The integrated intensity from a diffraction peak is proportional to the volume fraction of that material in a sample. This means that for a material with multiple phases, crystalline/amorphous or several crystalline phases, XRD can be used to determine the volume fraction of these phases. For a multi-phase metal this corresponds to a quantitative analysis of the phase composition.
There are alternative approaches to determination of phase composition including density measurements, thermal analysis and spectroscopy, but XRD remains the most robust and simplest technique so it is of dominant importance.
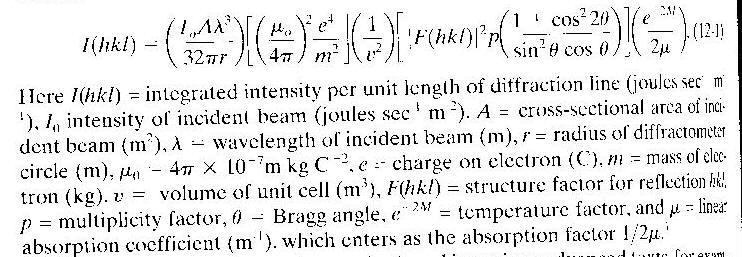
The intensity from a diffractometer in reflection geometry must be corrected for the angular dependence of absorption/beam profile and for the Lorentz Polarization factor which is also angularly dependent. In addition, account must be made for the multiplicity of planes in a crystal, variation in thermal broadening with angle and some other factors, see
equation
12-1 p. 348 (old Cullity14-1 p. 408).
Phase Composition for mixed phase metals (more than one crystal structure):
As Cullity described on p. 348(Old Cullity p. 408 to 409, equation 14-1),
equation 12-1 can be simplified for comparison of two reflections which correspond to two different phases in a metal sample, such as a powder mixture of molybdenum and copper. Equation 12-11
p. 352 (Old Cullity 14-11on p. 411) is used for such a case:
K is a constant which will cancel in intensity ratios, c
a is the concentration of the alpha component, Ra is an angular dependent term which is defined in equation 12-10, mm is the absorption coefficient for the mixture,
Appendix 8 p. 244. For two peaks, a and b, from two phases the concentration of the two phases can be determined by ratios of equation 12-11,
 and c
and c
a + cb = 1
For the copper and molybdenum mixture the diffraction patterns are indexed using FCC and BCC structures. The 110 peak of molybdenum can be compared with the 111 peak of copper to determine the relative contributions of the two components.
The parameter Rhkl(2
q) is given by,
When a crystal monochrometer is used (as in the
Phillips camera in lab) this equation is modified since some extent of
polarization occurs in the monochrometer. Cullity suggests using (1+cos22
a
cos22q)/(sin2q
cosq), where
2a is the angle the beam is
diverted in the monochrometer (project the beam path and measure the divergence
angle). This is about 45 degrees in the Phillips diffractometer using a
graphite monochromater. So, cos22a
is about 0.5. This is independent of the diffraction angle. The
other terms in the equation above are the same.
V is the volume of a unit cell, F is the structure factor which depends on the atomic scattering factor, f, of the elements in the phase and the crystal structure of the phase. The weighted average of multiple components can be used for f. The structure factors for cubic crystals are:
F = f for simple cubic for all reflections
F=2f for BCC when h+k+l is even
F= 4f for FCC for unmixed hkl
Appendix 10 has f (atomic scattering factors) for all elements as a function of angle.
p is the multiplicity factor (how many planes contribute to a reflection) and is given in
appendix 11 as a function of the Miller
indices of the planes and the crystal structure.
The temperature factor, e-2M, can be read off
Figure 4-21 on p.
155 (assume iron is similar to Cu and Mo in this respect). (Debye
Factor New)
The procedure to determine the composition of a Molybdenum/Copper powder mixture is as follows:
- Obtain a diffraction pattern either in numerical readout or in graphical form from the Phillips diffractometer (example
pattern is given above).
- Make a copy of the pattern and cut out the peaks corresponding to the two reflections discussed above. Weigh these cuttings and use this value as the integrated intensity for that reflection. You could also numerically integrate the peaks in excel (make sure to subtract the
Compton background first).
- Calculate the intensity ratio from the weights of the two areas.
- Calculate R for each phase and determine the concentration of the two phases.
Questions:
- Report values for the number and weight fraction zinc in the brass key.
- From the discussion in Cullity on p. 338-339 (Old Cullity 375-377) what are the problems with this analysis?
(Consider the effect of clustering of the minor component, deviation from a
cubic lattice and other effects mentioned by Cullity.)
Vegard's Law Problems
- Why does the copper wire pattern differ from the copper plate pattern? Which is better to use in this analysis or does it matter?
- Report the volume fraction Moly and Cu in the powder sample.
- Which of these techniques for phase analysis would be useful for the determination of martensite/austenite content in steel?
Crystal Structures of Metals
Atomic Scattering Factors "f"
Mass Absorption Coefficients
Multiplicity Factor "p"
Temperature Factor
Debye Factor New
Unit Cell Volume